Did you know that the average day trader spends 6 hours a day glued to their screens—just to make decisions in seconds? In the fast-paced world of day trading, mastering effective charting techniques is crucial for success. This article dives into essential strategies, including the significance of candlestick patterns, the role of volume in analysis, and how moving averages can refine your approach. You’ll also discover key indicators, the impact of support and resistance levels, and how to leverage charting software for optimal results. With insights on trend lines, technical analysis, Fibonacci retracements, and the Relative Strength Index (RSI), you'll learn how to identify chart patterns and avoid common pitfalls. Keep your skills sharp and stay updated on the latest trends with expert advice from DayTradingBusiness.
What are the best charting techniques for day traders?
The best charting techniques for day traders include:
1. Candlestick Patterns: Use candlestick charts to identify market trends and reversals. Look for patterns like doji, engulfing, and hammer.
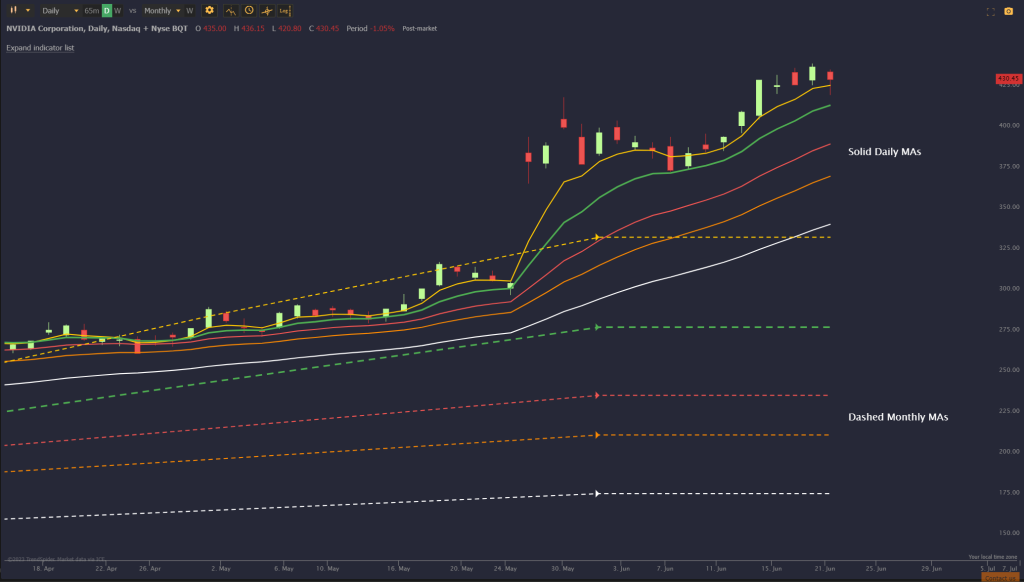
2. Moving Averages: Apply short-term moving averages (e.g., 9-day, 20-day) to spot trends and potential entry/exit points.
3. Support and Resistance Levels: Identify key support and resistance levels to make informed trading decisions.
4. Volume Analysis: Monitor trading volume alongside price movements to confirm trends or reversals. High volume often indicates strength.
5. Chart Patterns: Recognize chart patterns such as flags, pennants, and head-and-shoulders for potential breakout opportunities.
6. Technical Indicators: Use indicators like RSI, MACD, and Bollinger Bands to gauge momentum and overbought/oversold conditions.
7. Timeframes: Utilize multiple timeframes (e.g., 1-minute, 5-minute, 15-minute) for a comprehensive view of market action.
Incorporating these techniques can enhance your day trading strategy and improve decision-making.
How do candlestick patterns help day traders?
Candlestick patterns help day traders by providing visual cues about market sentiment and potential price movements. Patterns like doji, engulfing, and hammer indicate reversals or continuations, allowing traders to make quick decisions. Recognizing these shapes can signal entry and exit points, improving timing and maximizing profits. By analyzing patterns alongside volume and trend, day traders can enhance their strategies and manage risk more effectively.
What is the importance of volume in chart analysis for day trading?
Volume is crucial in day trading chart analysis because it indicates the strength of a price movement. High volume suggests strong interest and can validate trends, while low volume may signal weak momentum. Traders use volume to identify potential reversals, breakouts, or breakdowns. For instance, a price increase on high volume is more reliable than the same increase on low volume. Incorporating volume analysis helps day traders make informed decisions and manage risk effectively.
How can moving averages improve day trading strategies?
Moving averages can enhance day trading strategies by smoothing price data, helping traders identify trends and reversals. The simple moving average (SMA) reveals potential support and resistance levels, while the exponential moving average (EMA) responds more quickly to price changes, offering timely entry and exit signals. Using crossovers—like when a short-term EMA crosses above a long-term SMA—can indicate buy or sell opportunities. Additionally, moving averages can filter out market noise, allowing traders to focus on significant price movements and make more informed decisions.
What are the key indicators to use in day trading charts?

Key indicators for day trading charts include:
1. Moving Averages: Use the 50-day and 200-day for trend direction.
2. Relative Strength Index (RSI): Identify overbought or oversold conditions, typically above 70 or below 30.
3. MACD (Moving Average Convergence Divergence): Spot momentum shifts and trend reversals.
4. Bollinger Bands: Assess volatility and potential price reversals by monitoring price action relative to the bands.
5. Volume: Confirm trends and reversals by looking at volume spikes alongside price movements.
6. Stochastic Oscillator: Gauge momentum and potential reversals by comparing closing prices to price ranges over time.
These indicators help day traders make informed decisions about entry and exit points.
How do support and resistance levels affect day trading decisions?
Support and resistance levels guide day trading decisions by indicating potential price points where stocks may reverse or continue trends. Traders use these levels to identify entry and exit points. A stock approaching a support level might suggest a buying opportunity, while hitting resistance could signal a good exit or shorting chance. Monitoring these levels helps traders manage risk and set stop-loss orders effectively. Incorporating support and resistance into charting techniques enhances decision-making and improves trade outcomes.
What charting software is best for day traders?
The best charting software for day traders includes TradingView, Thinkorswim, and NinjaTrader. TradingView offers user-friendly charts and social features. Thinkorswim provides advanced analysis tools and real-time data. NinjaTrader is great for automated trading and strategy development. Each has unique strengths, so choose based on your trading style and needs.
How can day traders use trend lines effectively?
Day traders can use trend lines effectively by following these strategies:
1. Identify Trends: Draw trend lines by connecting the highs or lows on the chart. An upward trend line connects higher lows, while a downward trend line connects lower highs.
2. Set Entry and Exit Points: Use trend lines to identify potential entry points when the price touches a trend line and bounces back. Set exit points near the next level of resistance or support.
3. Confirm with Volume: Look for volume spikes at trend line breaks. High volume confirms the strength of a trend or reversal.
4. Combine with Other Indicators: Use trend lines alongside indicators like moving averages or RSI for stronger signals. This helps validate potential trades.
5. Adjust Regularly: Update trend lines as new highs or lows form. This keeps your analysis relevant to current market conditions.
Using these techniques, day traders can enhance their charting skills and make more informed trading decisions.
What role does technical analysis play in day trading?
Technical analysis is crucial in day trading as it helps traders identify price trends, patterns, and potential reversal points. By using charting techniques like moving averages, Bollinger Bands, and candlestick patterns, day traders can make informed decisions on entry and exit points. These tools provide insights into market sentiment and volatility, allowing traders to capitalize on short-term price movements effectively. Ultimately, technical analysis equips day traders with the strategies needed to navigate fast-paced markets.
How do Fibonacci retracements assist day traders?
Fibonacci retracements help day traders identify potential reversal levels in trending markets. By plotting key Fibonacci levels (like 23.6%, 38.2%, 50%, 61.8%, and 100%) between a high and low price, traders can spot areas where price may bounce or reverse. This technique assists in setting entry points, stop-loss orders, and profit targets. It enhances decision-making by providing a visual guide to market sentiment and potential support or resistance.
What are the advantages of using multiple time frames in charting?
Using multiple time frames in charting helps day traders identify trends, confirm signals, and improve entry and exit points. By analyzing short-term charts, you can spot immediate price movements, while longer time frames provide context and trend direction. This approach enhances decision-making, reduces false signals, and allows for better risk management. For example, a trader might use a 5-minute chart for precise entries and a 1-hour chart to ensure alignment with the overall trend.
How can day traders identify chart patterns for better entries?
Day traders can identify chart patterns for better entries by focusing on these techniques:
1. Candlestick Patterns: Look for formations like dojis, hammers, and engulfing patterns that indicate potential reversals or continuations.
2. Support and Resistance Levels: Identify key price levels where stocks historically reverse or consolidate, using horizontal lines or trendlines.
3. Moving Averages: Use short-term moving averages (like the 9 or 20-day) to spot trends and potential entry points when prices cross these averages.
4. Volume Analysis: Confirm chart patterns with volume spikes, as increased trading activity can validate breakouts or reversals.
5. Chart Patterns: Recognize classic patterns such as head and shoulders, triangles, and flags that signal potential price movements.
6. Time Frames: Analyze multiple time frames (like 1-minute, 5-minute, and 15-minute charts) to spot patterns and align your entries with broader trends.
7. Indicators: Utilize indicators like RSI or MACD to confirm entries based on chart patterns, helping you gauge overbought or oversold conditions.
By combining these techniques, day traders can improve their ability to identify chart patterns and make better entry decisions.
Learn about How to Identify Bullish and Bearish Patterns in Day Trading
What is the significance of the Relative Strength Index (RSI) in day trading?
The Relative Strength Index (RSI) is crucial in day trading for identifying overbought or oversold conditions. Traders use RSI values above 70 to signal potential sell opportunities and below 30 for buy signals. It helps gauge momentum, allowing traders to spot trend reversals early. Additionally, RSI can confirm price trends when used alongside other indicators, enhancing decision-making. Overall, it’s a key tool for improving entry and exit points in day trading strategies.
How can backtesting enhance charting techniques for day traders?
Backtesting enhances charting techniques for day traders by allowing them to validate their strategies against historical data. This process reveals how well a trading approach would have performed, helping traders identify effective patterns and indicators. By analyzing past price movements, traders can refine their charting methods, optimize entry and exit points, and minimize risk. Ultimately, backtesting improves decision-making and boosts confidence in chart-based strategies.
What are the common mistakes to avoid in day trading chart analysis?
Common mistakes to avoid in day trading chart analysis include:
1. Ignoring Trends: Not recognizing the overall market trend can lead to poor decisions. Always align trades with the prevailing trend.
2. Overcomplicating Analysis: Using too many indicators can create confusion. Stick to a few reliable tools that complement each other.
3. Neglecting Volume: Failing to consider trading volume can result in misleading signals. Always assess volume to validate price movements.
4. Overtrading: Taking too many trades can lead to emotional fatigue and mistakes. Set clear criteria for entering and exiting trades.
5. Lack of a Clear Plan: Trading without a defined strategy can cause impulsive decisions. Develop a solid trading plan and stick to it.
6. Ignoring Risk Management: Not using stop-loss orders can lead to significant losses. Always implement risk management strategies to protect your capital.
7. Focusing on Short-Term Movements: Getting caught up in minute-to-minute changes can distract from the bigger picture. Use higher time frames for context.
8. Emotional Trading: Letting fear or greed dictate trades can derail your strategy. Maintain discipline and stick to your plan.
Learn about Common Mistakes in Day Trading Analysis to Avoid
How can day traders stay updated on charting trends and techniques?
Day traders can stay updated on charting trends and techniques by following these strategies:
1. Online Courses: Enroll in courses focused on technical analysis and charting techniques.
2. Webinars: Attend live webinars hosted by experienced traders to learn new strategies.
3. Trading Platforms: Use advanced trading platforms that offer charting tools and educational resources.
4. Social Media: Follow trading experts and communities on Twitter, Reddit, and trading forums for real-time insights.
5. Newsletters: Subscribe to newsletters that provide analysis and updates on market trends.
6. Books: Read books on technical analysis to deepen your understanding of charting methods.
7. Practice: Regularly practice charting techniques on demo accounts to refine skills.
Staying engaged and continuously learning is key for day traders to adapt to market changes effectively.
Learn about How to Stay Updated on AI Trends in Day Trading?
Conclusion about Best Charting Techniques for Day Traders
Incorporating effective charting techniques is crucial for successful day trading. By utilizing candlestick patterns, understanding volume, and leveraging moving averages, traders can enhance their decision-making process. Key indicators, support and resistance levels, and trend lines further refine strategies, while technical analysis and tools like Fibonacci retracements provide deeper insights. Utilizing multiple time frames and the Relative Strength Index (RSI) can also significantly improve trading outcomes. To avoid common pitfalls and stay current with evolving charting trends, continuous learning is essential. For comprehensive resources and expert guidance, DayTradingBusiness remains your go-to partner in mastering these techniques.