Did you know that traders once used pigeons to send messages about stock prices? Fast forward to today, and we’ve got much better tools for identifying market trends! In this article, we’ll break down how to spot bullish and bearish patterns in day trading. You'll learn what defines these patterns, key indicators that signal market movements, and the importance of candlestick formations. We'll also cover the role of volume analysis, moving averages, and support and resistance levels in trend identification. Finally, we’ll provide tips on avoiding common mistakes and suggest practical tools for effective trend spotting. Whether you’re a beginner or looking to refine your strategy, DayTradingBusiness has you covered!
What are bullish patterns in day trading?
Bullish patterns in day trading indicate potential upward price movement. Common bullish patterns include:
1. Ascending Triangle: A series of higher lows with a flat resistance level.
2. Cup and Handle: A rounded bottom followed by a consolidation period, resembling a cup with a handle.
3. Bullish Flag: A sharp price increase followed by a brief consolidation, forming a rectangular shape.
4. Double Bottom: Two lows at a similar price level, suggesting strong support and a reversal.
5. Hammer Candlestick: A candlestick with a small body and a long lower shadow, indicating buying pressure.
Identifying these patterns can help traders anticipate upward trends in stock prices.
How can I recognize bearish patterns in day trading?
To recognize bearish patterns in day trading, look for the following signs:
1. Lower Highs and Lower Lows: Identify a sequence where each peak is lower than the previous one, indicating selling pressure.
2. Head and Shoulders: Watch for a peak (head) between two smaller peaks (shoulders). This suggests a reversal from bullish to bearish.
3. Double Top: Look for two peaks at roughly the same price level. If the price fails to break above the second peak, it often signals a downturn.
4. Bearish Candlestick Patterns: Spot patterns like the shooting star, bearish engulfing, or dark cloud cover on daily charts. These indicate potential reversals or continuations of bearish trends.
5. Volume Trends: Observe increasing volume on down days compared to up days. High volume on price declines signals strong selling interest.
6. Moving Averages: If the price falls below key moving averages (like the 50-day or 200-day), it can indicate a bearish trend.
Monitor these patterns closely to make informed trading decisions.
What key indicators signal a bullish trend?
Key indicators that signal a bullish trend include:
1. Higher Highs and Higher Lows: Prices consistently make higher peaks and troughs.
2. Moving Averages: The price is above its moving averages, particularly the 50-day and 200-day.
3. Volume Increase: Higher trading volume accompanying price increases indicates strong buying interest.
4. Bullish Candlestick Patterns: Patterns like engulfing, hammer, or morning star suggest upward momentum.
5. Relative Strength Index (RSI): An RSI above 50 indicates bullish strength.
6. MACD Crossover: The MACD line crosses above the signal line, indicating potential upward movement.
These indicators help identify a bullish trend in day trading.
What key indicators signal a bearish trend?
Key indicators that signal a bearish trend include:
1. Lower Lows and Lower Highs: Price consistently makes lower lows and lower highs.
2. Decreasing Volume: A drop in trading volume during price increases suggests weakening buying interest.
3. Moving Averages: The short-term moving average crosses below the long-term moving average (death cross).
4. RSI Below 30: Relative Strength Index (RSI) below 30 indicates oversold conditions, often preceding a price drop.
5. Bearish Candlestick Patterns: Patterns like shooting stars or bearish engulfing candles signal potential reversals.
6. MACD Divergence: When the price makes higher highs but the MACD shows lower highs, this divergence can indicate a trend reversal.
Monitoring these indicators can help traders identify and confirm bearish trends in day trading.
How do candlestick patterns indicate market sentiment?
Candlestick patterns indicate market sentiment by visually representing price movements and trader psychology. Bullish patterns, like the hammer or engulfing pattern, suggest increased buying pressure and optimism among traders, signaling potential upward movement. Conversely, bearish patterns, such as the shooting star or dark cloud cover, indicate selling pressure and pessimism, hinting at possible downward trends. Analyzing these patterns helps day traders gauge whether the market sentiment leans toward buying or selling, allowing them to make informed trading decisions.
What are the most common bullish reversal patterns?
The most common bullish reversal patterns are:
1. Hammer: A candle with a small body and a long lower wick, indicating buying pressure.
2. Inverted Hammer: Similar to the hammer but appears after a downtrend, signaling potential reversal.
3. Bullish Engulfing: A larger bullish candle engulfs the previous bearish candle, showing strong buying interest.
4. Morning Star: A three-candle pattern with a bearish candle, a small body, and a bullish candle, suggesting a reversal after a downtrend.
5. Double Bottom: Two troughs at similar price levels, indicating support and a potential upward move.
6. Triple Bottom: Like the double bottom but with three troughs, reinforcing the support level.
Look for these patterns at key support levels for stronger confirmation of a bullish reversal.
What are the most common bearish reversal patterns?
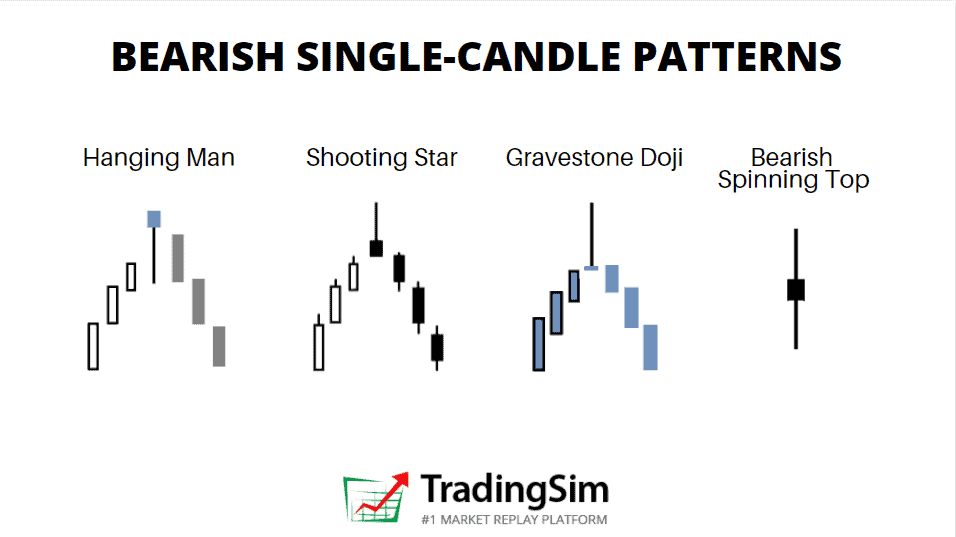
The most common bearish reversal patterns include:
1. Head and Shoulders: A peak (head) between two lower peaks (shoulders), signaling a trend reversal.
2. Double Top: Two peaks at roughly the same price level, indicating resistance and a potential price drop.
3. Triple Top: Three peaks at the same resistance level, reinforcing the likelihood of a reversal.
4. Rising Wedge: A narrowing price range that slopes upward, often leading to a bearish breakout.
5. Bearish Engulfing: A larger bearish candle completely engulfing the previous bullish candle, signaling selling pressure.
Identifying these patterns can help traders anticipate potential downtrends.
How can volume analysis help identify trends?
Volume analysis helps identify trends by showing the strength of price movements. High volume during price increases indicates strong bullish sentiment, suggesting a potential uptrend. Conversely, high volume during price declines signals strong bearish sentiment, indicating a possible downtrend. Tracking volume can also reveal reversals; for instance, a price rise on decreasing volume may suggest weakening momentum. By analyzing volume alongside price patterns, traders can make more informed decisions on bullish and bearish trends.
What role does moving average play in spotting patterns?
Moving averages help identify bullish and bearish patterns by smoothing price data, making trends clearer. A rising moving average suggests a bullish trend, while a falling one indicates a bearish trend. Traders often look for crossovers, like when a short-term moving average crosses above a long-term one, signaling a potential bullish pattern. Conversely, a crossover below suggests a bearish pattern. Additionally, moving averages can act as dynamic support or resistance levels, further aiding in pattern recognition.
How do support and resistance levels affect trend identification?
Support and resistance levels are crucial for identifying trends in day trading. Support levels indicate where a price tends to stop falling, signaling potential bullish reversals. Resistance levels show where prices often stop rising, hinting at bearish reversals. When prices break through these levels, it can confirm the strength of a trend. For example, if a stock consistently bounces off a support level, it suggests an uptrend. Conversely, if it fails to break a resistance level, it may indicate a downtrend. Tracking these levels helps traders make informed decisions about entering or exiting trades.
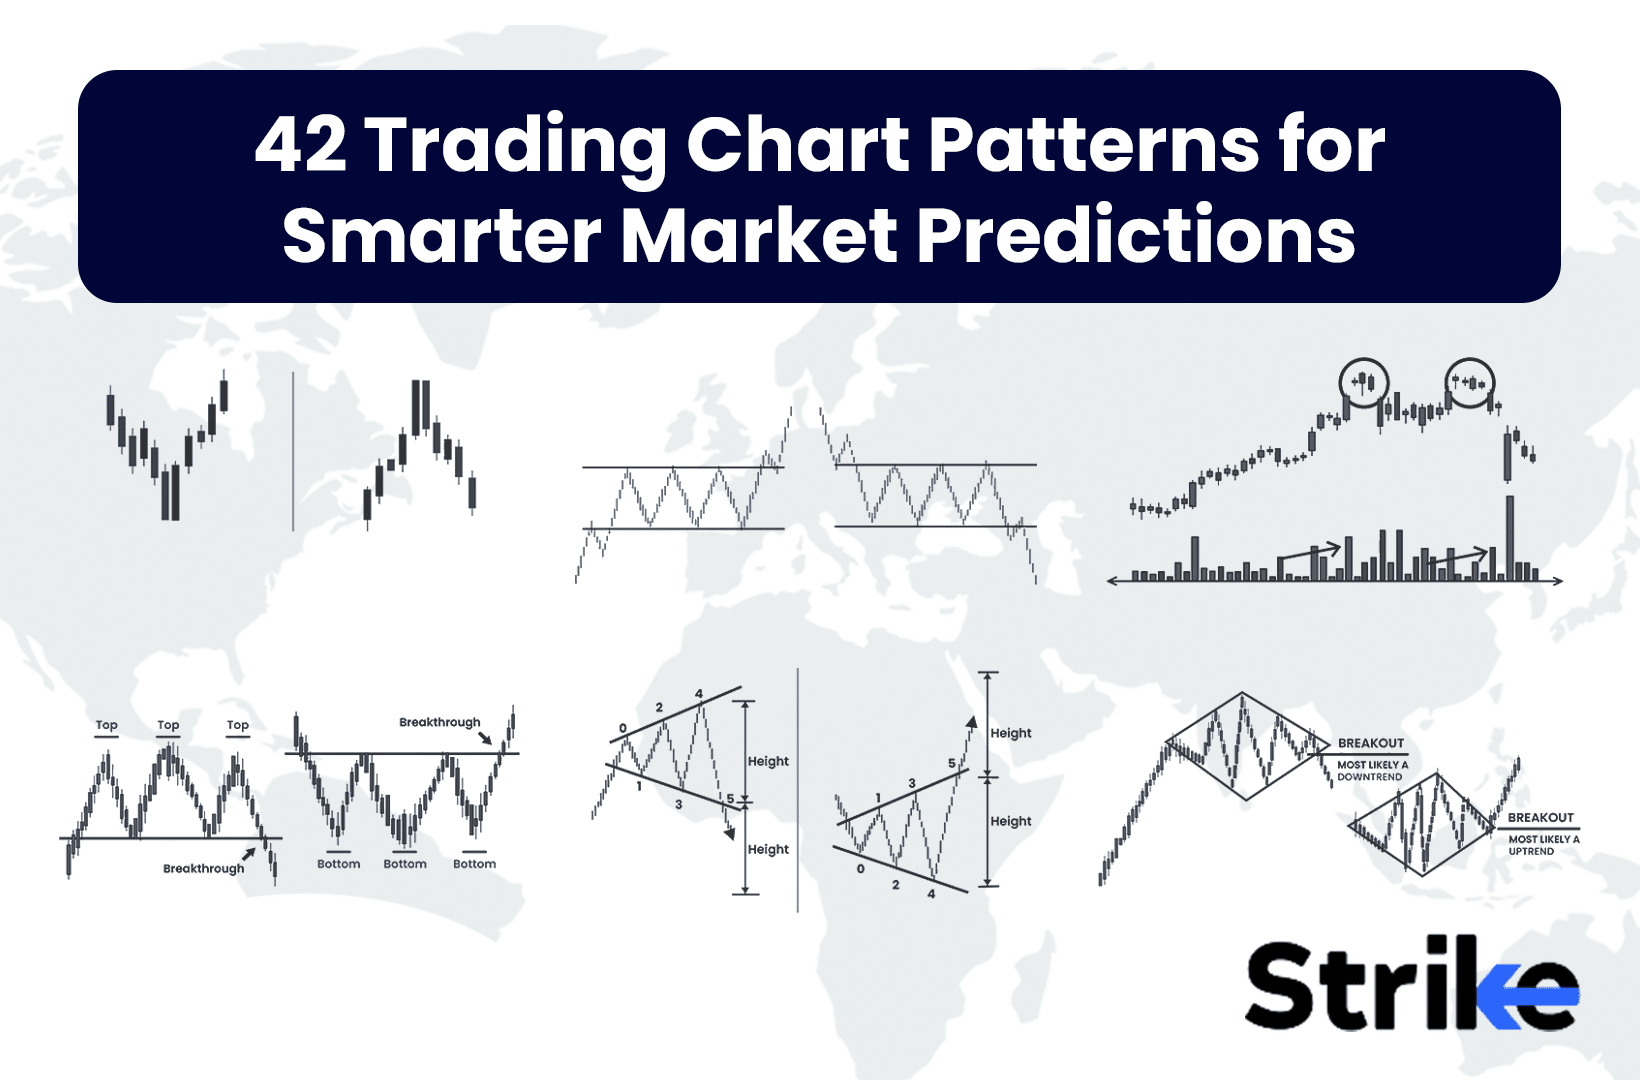
What are the implications of chart patterns for day trading?
Chart patterns are crucial for day trading as they signal potential price movements. Bullish patterns, like flags and triangles, indicate upward momentum, suggesting it may be a good time to buy. Conversely, bearish patterns, such as head and shoulders or double tops, signal possible downward trends, prompting traders to sell or short. Recognizing these patterns helps traders make informed decisions, manage risk, and optimize entry and exit points in their trades.
How can I use technical analysis to confirm trends?
To confirm trends using technical analysis in day trading, follow these steps:
1. Identify Patterns: Look for bullish patterns like ascending triangles or flags, and bearish patterns such as descending triangles or head and shoulders.
2. Use Trendlines: Draw trendlines to visualize the direction of the market. A confirmed trend is when prices consistently bounce off these lines.
3. Volume Analysis: Check volume alongside price movements. Increasing volume during price increases confirms a bullish trend, while rising volume during declines supports a bearish trend.
4. Moving Averages: Implement moving averages (e.g., 50-day, 200-day). A bullish trend is indicated when a shorter moving average crosses above a longer one, and vice versa for bearish trends.
5. Momentum Indicators: Utilize indicators like the Relative Strength Index (RSI) or MACD. An RSI above 70 can indicate an overbought condition (bearish signal), while below 30 can indicate oversold (bullish signal).
6. Support and Resistance Levels: Identify key support and resistance levels. A break above resistance confirms a bullish trend, while a drop below support indicates a bearish trend.
Apply these methods consistently to enhance your trend confirmation in day trading.
Learn about How to Use Technical Analysis for Day Trading ETFs
What tools can assist in identifying bullish and bearish patterns?
To identify bullish and bearish patterns in day trading, use these tools:
1. Candlestick Charts: Analyze patterns like hammers, shooting stars, and engulfing candles for trend signals.
2. Technical Indicators: Employ moving averages, RSI, and MACD to confirm bullish or bearish trends.
3. Chart Patterns: Look for formations such as head and shoulders, triangles, and flags that signal reversals or continuations.
4. Volume Analysis: Monitor volume spikes to validate price movements and confirm pattern strength.
5. Trading Software: Platforms like TradingView or ThinkorSwim have built-in tools for pattern recognition and alerts.
Utilizing these tools can enhance your ability to spot bullish and bearish trends effectively.
How do market news and events influence trading patterns?
Market news and events significantly influence trading patterns by affecting investor sentiment and stock volatility. Positive news, like strong earnings reports or favorable economic data, can lead to bullish patterns, prompting traders to buy, driving prices up. Conversely, negative news, such as poor economic indicators or geopolitical tensions, often results in bearish patterns, causing traders to sell, which leads to price declines.
To identify these patterns, watch for rapid price movements following major news announcements. Bullish patterns may include higher highs and increased volume, while bearish patterns often show lower lows and declining volume. Pay attention to market reactions to specific news events, as this can signal potential trading opportunities.
Learn about How News Events Impact Day Trading Decisions
What mistakes should I avoid when identifying market trends?
Avoid these mistakes when identifying market trends in day trading:
1. Relying solely on one indicator. Use a combination of tools like moving averages and RSI for better accuracy.
2. Ignoring volume. Patterns without significant volume can lead to false signals.
3. Overtrading based on short-term fluctuations. Stick to your strategy and avoid impulsive decisions.
4. Failing to consider news events. Economic reports can drastically shift market sentiment.
5. Neglecting risk management. Always set stop-loss orders to protect your capital.
6. Looking at past trends without context. Analyze the broader market conditions that could affect future movements.
7. Being influenced by emotions. Maintain objectivity and stick to your analysis.
Focus on these points to improve your trend identification and trading success.
How can I practice spotting bullish and bearish patterns effectively?
To practice spotting bullish and bearish patterns in day trading effectively, follow these steps:
1. Study Chart Patterns: Focus on common patterns like head and shoulders, flags, and triangles. Use historical charts to identify them.
2. Use Technical Indicators: Incorporate indicators such as moving averages, RSI, and MACD to confirm bullish or bearish signals.
3. Analyze Real-Time Data: Monitor live market charts to spot patterns as they form. Use platforms that allow for quick analysis.
4. Simulate Trading: Use demo accounts to practice identifying patterns without financial risk. Make trades based on your analysis to reinforce learning.
5. Join Trading Communities: Engage with other traders in forums or social media groups. Share insights and get feedback on your pattern recognition.
6. Keep a Trading Journal: Document your trades, patterns identified, and outcomes to refine your skills over time.
7. Review and Reflect: Regularly analyze past trades to understand what worked and what didn’t.
By combining these methods, you'll enhance your ability to spot bullish and bearish patterns in day trading.
Conclusion about How to Identify Bullish and Bearish Patterns in Day Trading
In conclusion, recognizing bullish and bearish patterns is crucial for successful day trading. By understanding key indicators, candlestick formations, and volume analysis, traders can make informed decisions. Utilizing tools and technical analysis further enhances pattern identification, while being mindful of market news and common mistakes can optimize trading strategies. For more insights and guidance on mastering these concepts, consider exploring the resources available through DayTradingBusiness.
Learn about How to Identify Reversal Patterns in Day Trading