Did you know that the average person makes about 35,000 decisions a day? For day traders, making informed decisions is crucial, and volume indicators are key tools in that process. In this article, you'll discover what volume indicators are and how they can enhance your trading strategies. We’ll explore popular volume indicators like VWAP, OBV, and the Accumulation/Distribution line, and explain how they help in trend confirmation and potential reversals. Learn to interpret the Chaikin Money Flow, Average True Range, and the limitations of these indicators. Additionally, we’ll cover best practices for combining volume indicators with other technical analysis tools, enabling you to identify false signals and adapt to varying market conditions. Join DayTradingBusiness as we guide you through the essentials of volume indicators every day trader should know.
What are volume indicators in day trading?
Volume indicators in day trading measure the number of shares or contracts traded in a specific timeframe. Key volume indicators include:
1. Volume: Basic metric showing total shares traded.
2. On-Balance Volume (OBV): Combines price movement and volume to indicate buying or selling pressure.
3. Accumulation/Distribution Line: Assesses price movement and volume to show whether a stock is being accumulated or distributed.
4. Chaikin Money Flow (CMF): Indicates buying and selling pressure over a specified period, factoring in both price and volume.
5. Average Volume: Shows the average number of shares traded over a set period, helping to identify unusual spikes.
These indicators help traders gauge market strength, identify trends, and make informed decisions.
How do volume indicators help in trading decisions?
Volume indicators help in trading decisions by showing the strength of price movements. High volume indicates strong interest, suggesting that a price move is likely to continue. Conversely, low volume may signal a lack of conviction, leading traders to be cautious. For example, if a stock rises on high volume, it indicates strong buying pressure, making it a potential buy signal. On the other hand, if a price increase occurs with low volume, it may not be sustainable. Traders use volume indicators, like the Volume Moving Average or On-Balance Volume, to confirm trends and identify potential reversals.
Which are the most popular volume indicators for day traders?
The most popular volume indicators for day traders include:
1. On-Balance Volume (OBV): Measures buying and selling pressure by adding volume on up days and subtracting on down days.
2. Volume Moving Average: Averages volume over a specific period to identify trends and anomalies.
3. Accumulation/Distribution (A/D): Combines price and volume to indicate whether a stock is being accumulated or distributed.
4. Chaikin Money Flow (CMF): Combines price and volume over a set timeframe to show the buying and selling pressure.
5. Volume Rate of Change (VROC): Shows the percentage change in volume over a specific period.
These indicators help day traders gauge market strength and make informed decisions based on trading volume.
How do you use the Volume Weighted Average Price (VWAP)?
To use the Volume Weighted Average Price (VWAP), follow these steps:
1. Calculate VWAP: Use the formula: VWAP = (Cumulative Typical Price × Cumulative Volume) / Cumulative Volume. The typical price is the average of the high, low, and close for a given period.
2. Identify Trading Sessions: Use VWAP during the trading day to gauge the average price based on volume. It resets at the start of each day.
3. Trading Signals: Buy when the price is above VWAP, indicating an uptrend. Sell or short when the price is below VWAP, suggesting a downtrend.
4. Support and Resistance: Use VWAP as a dynamic support or resistance level. Prices often react around the VWAP line.
5. Combine with Other Indicators: Enhance your strategy by pairing VWAP with other indicators like moving averages or RSI for confirmation.
Apply these steps for effective trading decisions based on VWAP.
What is the significance of the On-Balance Volume (OBV)?
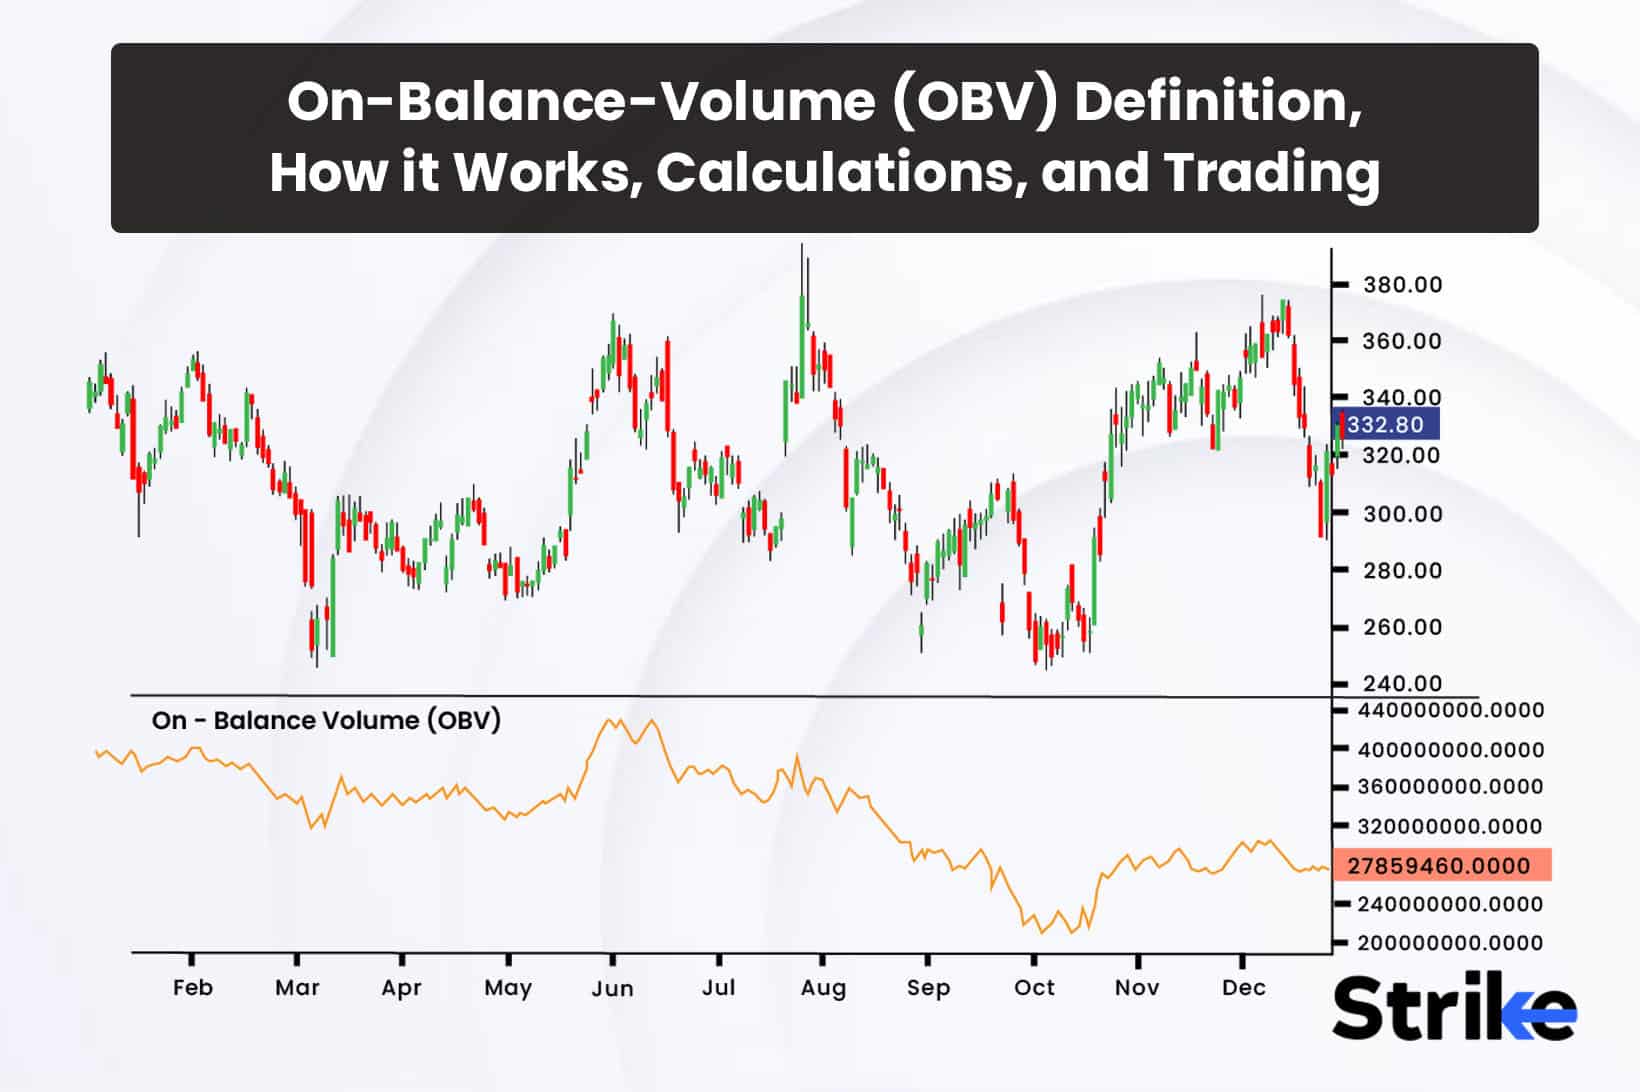
On-Balance Volume (OBV) is significant because it uses volume flow to predict price movements. When OBV rises, it indicates that buying pressure is increasing, often leading to price increases. Conversely, a falling OBV suggests selling pressure, which can foreshadow price declines. Day traders use OBV to confirm trends and identify potential reversals, making it a vital tool for understanding market momentum.
How does the Accumulation/Distribution line work?
The Accumulation/Distribution line measures the relationship between price and volume to indicate buying and selling pressure. It calculates a cumulative total based on whether the market closes higher or lower than the previous close. If the close is higher, the day's volume is added; if lower, it's subtracted.
A rising A/D line suggests accumulation—more buying than selling—indicating potential bullish trends. Conversely, a falling A/D line signals distribution—more selling than buying—hinting at bearish trends. Day traders use this indicator to confirm price movements and make informed entry and exit decisions.
What does the Chaikin Money Flow indicator indicate?
The Chaikin Money Flow (CMF) indicator measures the buying and selling pressure over a specified period, combining price and volume data. A positive CMF indicates strong buying pressure, while a negative CMF suggests selling pressure. Traders use it to identify potential trends and reversals in the market.
How can you interpret the Average True Range (ATR) with volume?
To interpret the Average True Range (ATR) with volume, look for the relationship between volatility and trading activity. A rising ATR with increasing volume suggests strong market interest and potential price movement, indicating a good opportunity for trades. Conversely, if ATR rises but volume declines, it may signal false volatility, meaning price movements could lack conviction. Always consider combining ATR and volume with other indicators for a more comprehensive analysis.
What role do volume indicators play in trend confirmation?
Volume indicators are crucial for trend confirmation as they measure the strength behind price movements. High volume during an uptrend suggests strong buyer interest, reinforcing the trend's validity. Conversely, low volume in a downtrend may indicate a lack of conviction, signaling potential reversal. By analyzing volume alongside price action, traders can better assess whether to enter or exit positions, making volume indicators essential for effective day trading strategies.
How can volume indicators signal potential reversals?
Volume indicators can signal potential reversals by showing changes in trading activity. When volume spikes during a price move, it indicates strong interest, suggesting the trend might continue. Conversely, if price rises or falls with decreasing volume, it may signal a weakening trend and a potential reversal. Look for patterns like volume divergence, where price moves in one direction but volume trends in the opposite, hinting at a possible reversal. Additionally, volume at key support or resistance levels can provide clues; a strong volume breakout through resistance may confirm a bullish reversal, while high volume at support can signal a bearish reversal.
What are the limitations of using volume indicators?
Volume indicators can be limited by several factors. First, they can lag behind price movements, providing delayed signals. Second, high volume doesn't always indicate strength; it can result from panic selling or market manipulation. Third, volume data may not account for off-exchange trades, leading to incomplete insights. Finally, different markets and assets can have varying volume characteristics, making comparisons unreliable.
How do you combine volume indicators with other technical analysis tools?
To combine volume indicators with other technical analysis tools, start by using volume to confirm trends indicated by price patterns. For example, if a stock breaks out of resistance with high volume, it suggests strength in the move.
Next, pair volume with moving averages; increased volume during a crossover signals potential continuation of the trend. Use volume with oscillators like RSI; if RSI shows overbought conditions while volume decreases, it may signal a reversal.
Additionally, apply volume analysis alongside candlestick patterns; a bullish engulfing pattern with rising volume strengthens the buy signal. Always consider context—look at historical volume levels to assess whether current volume is significant. This multi-tool approach enhances your trading strategies and decision-making.
Learn about Integrating Volume Analysis with Other Indicators
What are the best practices for using volume indicators in day trading?
The best practices for using volume indicators in day trading include:
1. Confirming Trends: Use volume to confirm the strength of a price trend. Higher volume during price increases indicates strong buying interest, while high volume during price declines suggests strong selling pressure.
2. Identifying Breakouts: Look for volume spikes on breakouts. A significant increase in volume can signal that a breakout is legitimate and likely to continue.
3. Divergence Analysis: Watch for volume divergence. If prices are rising but volume is falling, it may indicate weakening momentum, suggesting a potential reversal.
4. Setting Alerts: Set volume alerts to notify you of significant changes. This helps catch important trading opportunities without constant monitoring.
5. Combining with Price Action: Use volume indicators alongside price action for better analysis. For instance, a bullish candle with high volume is more reliable than one with low volume.
6. Adjusting Timeframes: Analyze volume across different timeframes. Shorter timeframes can provide immediate insights, while longer ones help identify overall trends.
7. Using Multiple Indicators: Combine volume indicators like On-Balance Volume (OBV) or Volume Weighted Average Price (VWAP) with other technical indicators for a comprehensive view.
8. Avoiding Over-reliance: Don’t rely solely on volume indicators. Use them as part of a broader trading strategy that includes technical analysis and market news.
Implementing these practices can enhance your day trading effectiveness and decision-making.
Learn about What Are the Best Practices for Using AI in Day Trading?
How can you identify false signals with volume indicators?
To identify false signals with volume indicators, look for discrepancies between price movements and volume trends. If a price increase occurs with low volume, it could indicate a lack of conviction and suggest a potential reversal. Conversely, a price drop on high volume may signal strong selling pressure. Use moving averages of volume to filter out noise; spikes above average can highlight genuine interest. Additionally, watch for divergences where price makes new highs or lows but volume does not follow. This can indicate weakening momentum. Always combine volume analysis with other indicators for more reliable signals.
What are the differences between volume indicators and price indicators?
Volume indicators measure the number of shares or contracts traded in a specific timeframe, reflecting market activity and liquidity. Price indicators, on the other hand, analyze price movements and trends, helping traders identify potential entry and exit points.
Key differences include:
1. Focus: Volume indicators concentrate on trade quantity, while price indicators focus on price changes.
2. Purpose: Volume indicators signal strength or weakness of a price move; price indicators help determine trend direction.
3. Examples: Common volume indicators include On-Balance Volume (OBV) and Volume Moving Average. Price indicators include Moving Averages and Relative Strength Index (RSI).
Using both together can enhance trading strategies by confirming price trends with volume data.
How do volume indicators vary across different market conditions?
Volume indicators vary significantly across market conditions. In trending markets, high volume often confirms the trend's strength, signaling that the movement is likely to continue. In contrast, low volume during a trend may indicate weakness or a potential reversal.
In ranging markets, increased volume can suggest the breakout direction, while low volume often signals indecision. During news events, volume spikes may occur, reflecting heightened activity and potential volatility. Recognizing these patterns helps day traders make informed decisions based on market conditions.
Conclusion about Volume Indicators Every Day Trader Should Know
Incorporating volume indicators into your day trading strategy can significantly enhance your decision-making process. These tools provide critical insights into market strength and potential reversals, helping traders confirm trends and identify false signals. While they have limitations, effective use of indicators like VWAP, OBV, and ATR can lead to more informed trades. For comprehensive support and resources on mastering volume indicators and optimizing your trading approach, DayTradingBusiness is here to guide you every step of the way.
Learn about FINRA Regulations Every Day Trader Should Know