Did you know that day traders sometimes refer to earnings reports as "financial fireworks"? Just like a spectacular display, these reports can light up trading opportunities but require careful observation to avoid being dazzled by the wrong signals. In our article, we delve into the essentials of conducting fundamental analysis for day trading. Discover what fundamental analysis is and why it's crucial for making informed trading decisions. Learn how to gather key financial data and identify pivotal ratios, along with the influence of earnings reports and economic news on your trades. We'll also explore industry trends, valuation metrics, and the impact of interest rates. Plus, gain insights into common pitfalls, sentiment analysis, and the best tools for your analysis. Stay updated on how to evaluate a stock's growth potential with fundamental insights—all with the expertise of DayTradingBusiness.
What is fundamental analysis in day trading?
Fundamental analysis in day trading involves evaluating a company’s financial health and market position to inform short-term trading decisions. Focus on key indicators like earnings reports, revenue growth, and news events that influence stock prices.
To conduct fundamental analysis for day trading, start by reviewing earnings announcements, economic data releases, and industry news. Analyze financial ratios such as P/E ratio and debt-to-equity. Monitor market sentiment through social media and news outlets. Use this information to identify potential price movements and make informed trades within a single trading day.
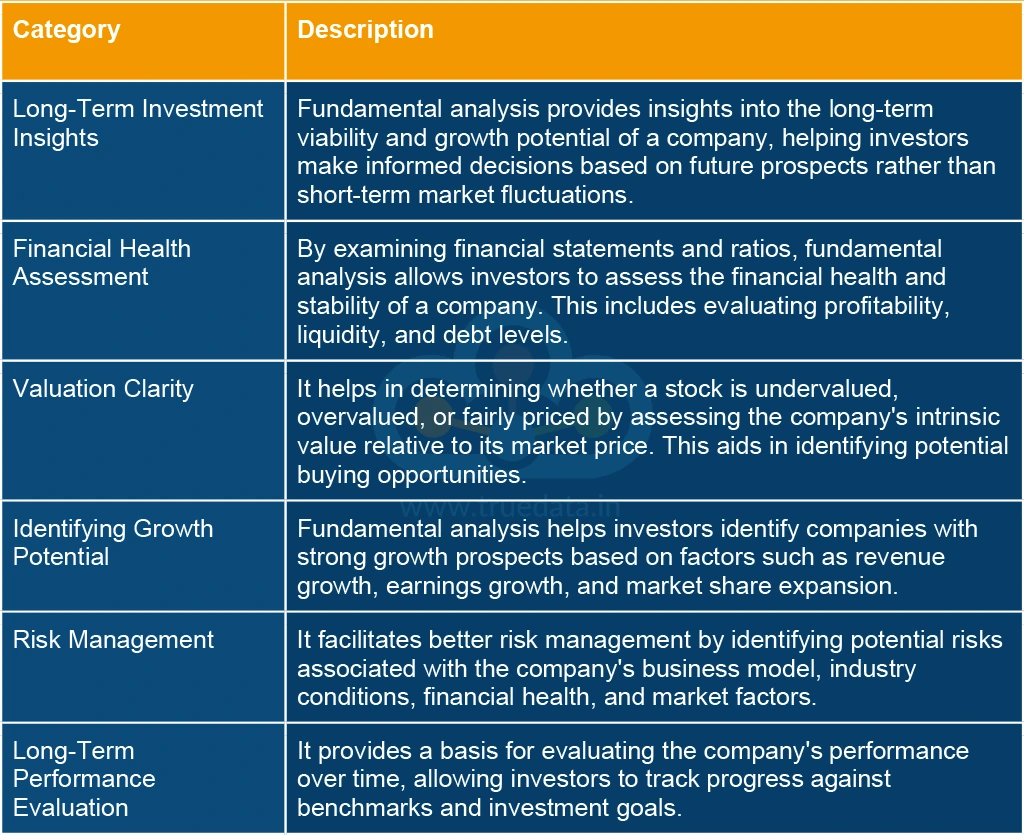
Why is fundamental analysis important for day traders?
Fundamental analysis is crucial for day traders because it helps them understand the underlying factors driving stock prices. By analyzing earnings reports, economic indicators, and news events, traders can identify potential price movements and make informed decisions. This knowledge allows day traders to spot opportunities and manage risks effectively, enhancing their chances of success in the fast-paced market.
How do you gather financial data for fundamental analysis?
To gather financial data for fundamental analysis in day trading, start by accessing reliable financial news websites and stock market platforms like Yahoo Finance, Bloomberg, or MarketWatch. Look for key metrics such as earnings reports, revenue growth, price-to-earnings (P/E) ratios, and dividends. Utilize financial statements—balance sheets, income statements, and cash flow statements—available from company filings or investor relations pages. Monitor economic indicators and sector performance for broader context. Use stock screeners to filter stocks based on your criteria. Finally, keep an eye on analyst ratings and forecasts to inform your decisions.
What key financial ratios should day traders focus on?
Day traders should focus on the following key financial ratios:
1. Price-to-Earnings (P/E) Ratio: Indicates how much investors are willing to pay per dollar of earnings.
2. Price-to-Sales (P/S) Ratio: Measures the price investors pay for each dollar of sales, useful for assessing valuation.
3. Return on Equity (ROE): Shows how effectively a company generates profit from shareholders' equity.
4. Current Ratio: Assesses a company's ability to pay short-term liabilities with short-term assets.
5. Debt-to-Equity (D/E) Ratio: Indicates the proportion of company financing that comes from debt versus equity, highlighting financial risk.
These ratios help day traders evaluate a stock's potential for short-term price movements.
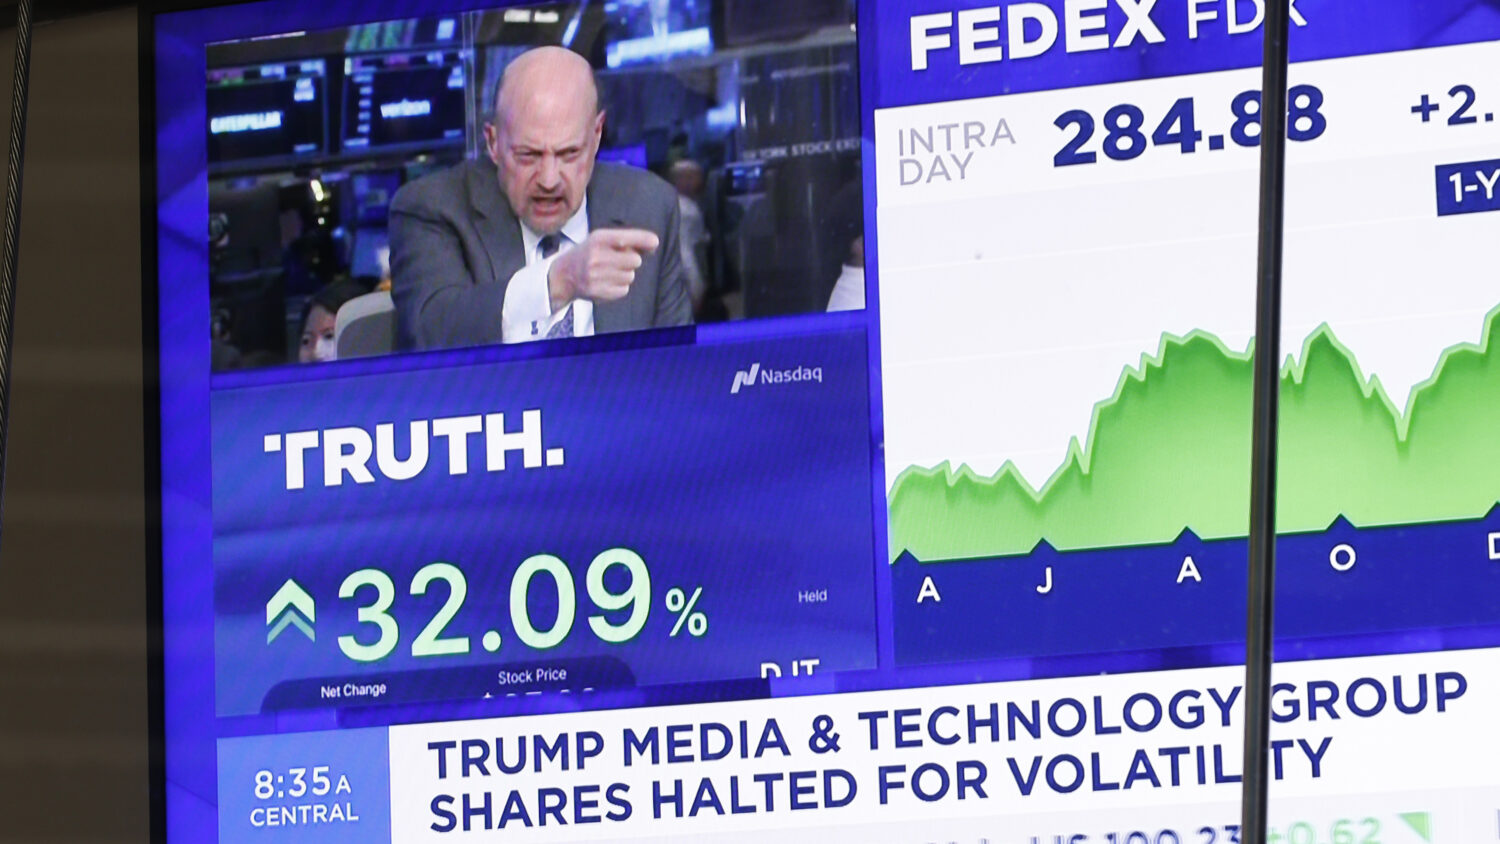
How can earnings reports influence day trading decisions?
Earnings reports can significantly influence day trading decisions by providing insights into a company's financial health and future prospects. Traders often react to earnings beats or misses, which can lead to rapid price movements. Positive earnings can trigger buying, while negative results may prompt selling. Additionally, guidance and forecasts in the report can shape market sentiment and volatility, creating opportunities for quick trades. Monitoring analyst reactions and market trends post-report can also inform entry and exit points for day traders.
What role does economic news play in day trading?
Economic news is crucial for day trading as it impacts market volatility and price movements. Traders use economic indicators like GDP, unemployment rates, and inflation data to gauge market sentiment and make quick decisions. Positive news can drive stock prices up, while negative reports can trigger sell-offs. Understanding the timing and implications of economic releases helps traders anticipate market reactions and adjust their strategies accordingly. For effective fundamental analysis, focus on key reports and stay updated on economic calendars to capitalize on trading opportunities.
How do industry trends affect fundamental analysis?
Industry trends significantly impact fundamental analysis by influencing a company's performance, growth potential, and valuation. When you analyze a stock for day trading, consider how trends like market demand, technological advancements, and regulatory changes affect its sector. For instance, if the tech industry is booming, tech stocks may see increased earnings projections, altering their price-to-earnings ratios.
Staying updated on these trends helps you assess whether a stock is undervalued or overvalued, guiding your trading decisions. Always integrate industry insights into your financial ratios, earnings reports, and competitive positioning to make informed trades.
What are the best sources for fundamental analysis data?
The best sources for fundamental analysis data in day trading include:
1. Financial News Websites: Bloomberg, CNBC, and Reuters provide real-time updates and insights.
2. Company Filings: SEC filings, such as 10-Q and 10-K reports, offer detailed financial information.
3. Earnings Reports: Look for quarterly and annual earnings releases directly from company websites.
4. Market Data Providers: Services like Yahoo Finance and Google Finance give access to key financial metrics.
5. Analyst Reports: Investment banks and research firms publish analyses and forecasts that can guide trading decisions.
6. Economic Indicators: Government websites provide data on GDP, unemployment rates, and inflation, affecting market trends.
Using these sources helps you assess a stock's financial health, market position, and potential for short-term price movements.
How can valuation metrics guide day trading strategies?
Valuation metrics like P/E ratio, P/B ratio, and earnings reports can help day traders identify stocks with potential price movements. By analyzing these metrics, traders can spot undervalued or overvalued stocks, guiding their buy or sell decisions. For instance, a low P/E ratio compared to industry peers might signal a potential bounce-back opportunity. Additionally, monitoring earnings announcements can help traders anticipate volatility and capitalize on price swings. Using these metrics effectively can enhance decision-making and improve day trading results.
What is the significance of company news in day trading?
Company news is crucial in day trading because it can cause rapid price movements. Traders use news to identify catalysts that may lead to short-term gains. Earnings reports, product launches, and regulatory changes can significantly impact stock prices. Monitoring news allows traders to make informed decisions quickly, capitalize on volatility, and manage risk effectively.
How do interest rates impact day trading fundamentals?
Interest rates directly impact day trading fundamentals by influencing market volatility and asset prices. When interest rates rise, borrowing costs increase, which can lead to lower corporate profits and reduced consumer spending. This often results in declining stock prices, creating trading opportunities. Conversely, lower interest rates can boost market sentiment, driving prices up and increasing volatility. Day traders must monitor interest rate changes and economic indicators to anticipate market movements and adjust their strategies accordingly.
Learn about The Impact of Interest Rates on Day Trading Strategies
What are common mistakes in fundamental analysis for day trading?
Common mistakes in fundamental analysis for day trading include:
1. Ignoring Earnings Reports: Traders often overlook key earnings announcements, which can significantly impact stock prices.
2. Misinterpreting News: Misreading the implications of news releases can lead to poor trading decisions.
3. Focusing on Long-Term Metrics: Day traders may fixate on long-term fundamentals rather than short-term catalysts.
4. Neglecting Market Sentiment: Ignoring how sentiment affects stock movement can result in missed opportunities.
5. Overreacting to Data: Traders sometimes overreact to minor data releases, leading to unnecessary trades.
6. Lack of a Trading Plan: Failing to integrate fundamental analysis into a clear trading strategy can lead to inconsistent results.
7. Not Monitoring Economic Indicators: Ignoring key economic indicators can leave traders unprepared for market shifts.
Avoid these pitfalls to enhance your fundamental analysis for day trading.
Learn about Common Mistakes in Day Trading Fundamental Analysis
How can sentiment analysis complement fundamental analysis?
Sentiment analysis can enhance fundamental analysis in day trading by providing real-time insights into market emotions and reactions. While fundamental analysis focuses on a company's financial health and intrinsic value, sentiment analysis gauges public perception and market trends. This combination allows traders to identify potential price movements driven by news, social media, or market sentiment shifts. For example, if positive earnings reports coincide with optimistic social media sentiment, it may signal a good entry point. Integrating both approaches helps traders make more informed decisions and react swiftly to market changes.
What tools are available for conducting fundamental analysis?
For conducting fundamental analysis in day trading, you can use the following tools:
1. Financial News Websites: Bloomberg, Reuters, and CNBC provide real-time updates on market news and economic indicators.
2. Stock Screeners: Tools like Finviz or Yahoo Finance allow you to filter stocks based on key financial metrics.
3. Earnings Reports: Access company filings on sites like EDGAR or directly from the company's investor relations page.
4. Analyst Reports: Services like Morningstar or Zacks offer in-depth analysis and ratings on stocks.
5. Economic Calendars: Websites like Forex Factory and Investing.com display upcoming economic events that could impact markets.
6. Trading Platforms: Many brokers, like TD Ameritrade or E*TRADE, provide integrated research tools and data for analysis.
Using these tools effectively can help you make informed decisions based on fundamental analysis in day trading.
How often should you update your fundamental analysis for day trading?
You should update your fundamental analysis for day trading daily, as market conditions and news can change rapidly. Monitor company earnings reports, economic indicators, and sector news each morning before trading. Stay alert to any breaking news throughout the day that could impact stock prices. Regular updates ensure you make informed decisions based on the latest information.
Learn about How to Create a Fundamental Analysis Report for Day Trading
How can you evaluate a stock's growth potential through fundamentals?
To evaluate a stock's growth potential through fundamentals for day trading, focus on these key areas:
1. Earnings Growth: Look for consistent earnings increases over the past few quarters. A rising trend indicates strong business health.
2. Revenue Trends: Check revenue growth year-over-year. Increasing sales suggest potential for future expansion.
3. Profit Margins: Analyze gross and net profit margins. Higher margins can indicate efficiency and pricing power.
4. P/E Ratio: Compare the price-to-earnings ratio with industry peers. A lower P/E may suggest undervaluation, while a higher one could indicate growth expectations.
5. Debt Levels: Assess the debt-to-equity ratio. Lower debt levels typically mean less risk, especially in volatile markets.
6. Market Position: Evaluate the company's competitive advantage. Strong brands or unique products often lead to sustained growth.
7. Management Quality: Research the management team's track record. Experienced leaders can drive company success.
8. Market Trends: Consider industry growth rates and broader economic indicators. Aligning with growing sectors can enhance growth potential.
Use these fundamentals as a basis for making informed trading decisions based on growth potential.
Conclusion about How to Conduct Fundamental Analysis for Day Trading?
Incorporating fundamental analysis into your day trading strategy is essential for making informed decisions. By understanding key financial metrics, evaluating earnings reports, and staying updated on economic news, traders can better navigate market fluctuations. Avoid common pitfalls and utilize credible sources for reliable data. Regularly updating your analysis and leveraging sentiment can further enhance your trading effectiveness. For comprehensive insights and support in mastering these techniques, consider the resources available at DayTradingBusiness.
Learn about How to Create a Fundamental Analysis Report for Day Trading