Did you know that even the stock market has favorite hangout spots? Just like people, stocks love to bounce off certain price levels—these are known as support and resistance levels. In the realm of day trading, mastering these concepts is crucial for making informed decisions. This article delves into the essentials of identifying and utilizing support and resistance levels, exploring their impact on trading strategies, tools for identification, and the nuances of hard vs. soft levels. We’ll also cover how psychological factors, trendlines, and Fibonacci retracement come into play, alongside practical tips for navigating volatile markets. With insights on common patterns, volume correlations, and the influence of news events, you’ll be equipped to enhance your trading strategies. Plus, we’ll highlight common pitfalls to avoid and the value of backtesting in refining your approach. Join us at DayTradingBusiness as we uncover the secrets to successful trading through support and resistance!
What are support and resistance levels in day trading?
Support levels are price points where a stock tends to stop falling and may bounce back up, indicating buying interest. Resistance levels are points where a stock struggles to rise further, showing selling pressure. In day trading, identifying these levels helps traders make decisions about entry and exit points. Support can be identified through previous low price points, while resistance can be found at previous highs. Look for patterns, moving averages, and volume spikes to confirm these levels.
How do support and resistance levels affect trading decisions?
Support and resistance levels guide trading decisions by indicating potential price points where stocks may reverse or stall. Traders often buy near support, anticipating a bounce, or sell near resistance, expecting a drop. Identifying these levels helps in setting entry and exit points, managing risk, and confirming trends. For instance, if a stock approaches a resistance level and shows signs of weakness, a trader might decide to sell. Conversely, if it bounces off support with strong volume, it could signal a buying opportunity. Understanding these levels is crucial for making informed day trading choices.
What tools can help identify support and resistance levels?
To identify support and resistance levels in day trading, use these tools:
1. Trend Lines: Draw lines connecting highs or lows to spot potential support and resistance areas.
2. Moving Averages: Use 50-day or 200-day moving averages to identify dynamic support and resistance.
3. Fibonacci Retracement: Apply this tool to find key retracement levels that often act as support or resistance.
4. Pivot Points: Calculate pivot points to determine potential reversal levels for the day.
5. Volume Profile: Analyze volume at price levels to identify where significant buying or selling occurred, indicating support or resistance.
6. Candlestick Patterns: Look for reversal patterns near previous highs or lows for hints of support and resistance.
Utilizing these tools can enhance your day trading strategy by providing clearer insights into market movements.
How can I draw support and resistance levels on a chart?
To draw support and resistance levels on a chart, follow these steps:
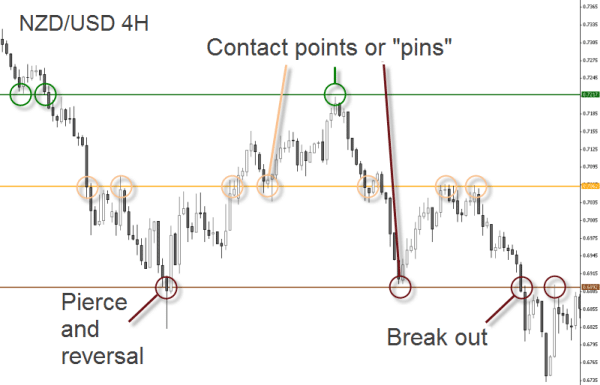
1. Identify Significant Highs and Lows: Look for previous price points where the market reversed direction. These are potential resistance (highs) and support (lows) levels.
2. Use Horizontal Lines: Draw horizontal lines at those identified highs and lows. These lines represent where price has struggled to break above or below.
3. Look for Clusters: Focus on areas where multiple highs or lows converge, as these indicate stronger support or resistance.
4. Check Timeframes: Analyze different timeframes (daily, hourly, etc.) to confirm levels. Strong support and resistance often appear across multiple timeframes.
5. Adjust for Recent Price Action: Update your levels based on recent price movements and consider adjusting them as new highs and lows form.
6. Combine with Other Indicators: Use tools like moving averages or Fibonacci retracements to reinforce your support and resistance levels.
This method will help you effectively identify key price levels for day trading.
What is the difference between hard and soft support and resistance?
Hard support and resistance levels are price points where the market has consistently reversed direction, often due to strong buying or selling pressure. These levels are typically marked by clear historical highs and lows, making them more reliable.
Soft support and resistance, on the other hand, are more fluid and can change based on market conditions. They’re often identified through trend lines or moving averages and can be breached temporarily, leading to less certainty about their strength.
In day trading, hard levels are crucial for setting stop-loss orders, while soft levels can provide potential entry and exit points based on market momentum.
How do psychological levels influence support and resistance?
Psychological levels influence support and resistance in day trading by acting as key price points where traders collectively place buy or sell orders. These levels, often round numbers like $50 or $100, create mental barriers. When prices approach these levels, traders anticipate reversals or breakouts, leading to increased buying or selling activity. As a result, these psychological levels can become self-fulfilling prophecies, reinforcing the support or resistance as more traders react to them.
What role do trendlines play in identifying support and resistance?
Trendlines are essential in identifying support and resistance levels in day trading. They visually represent price trends over time, helping traders spot areas where the price frequently reverses. An upward trendline indicates support, as prices tend to bounce off this line. Conversely, a downward trendline suggests resistance, where prices often hit a ceiling. By connecting the highs or lows on a price chart, trendlines provide clear signals for entry and exit points, enhancing trading decisions.
How can I use Fibonacci retracement for support and resistance?
To use Fibonacci retracement for support and resistance in day trading, follow these steps:
1. Identify a significant price movement, either a high to low or low to high.
2. Draw the Fibonacci retracement levels on your chart from the peak to the trough (or vice versa).
3. Look for key Fibonacci levels—typically 23.6%, 38.2%, 50%, 61.8%, and 78.6%.
4. Watch how price reacts at these levels; they often act as support or resistance.
5. Confirm with other indicators, like volume or candlestick patterns, for stronger signals.
6. Use these levels to set entry points, stop-loss orders, and profit targets.
This method helps pinpoint potential reversal areas and manage trades effectively.
What are common patterns associated with support and resistance?
Common patterns associated with support and resistance in day trading include:
1. Horizontal Levels: Price often bounces off established support or resistance lines, indicating strong buying or selling interest at those levels.
2. Trendlines: Diagonal lines drawn along the lows (support) or highs (resistance) of price movements can highlight potential reversal points.
3. Candlestick Patterns: Reversal patterns like hammers at support or shooting stars at resistance can signal price changes.
4. Volume Clusters: High trading volume near support or resistance levels can confirm the strength of those levels.
5. Moving Averages: These can act as dynamic support or resistance, with price often reacting to their proximity.
6. Fibonacci Levels: Traders often use Fibonacci retracement levels to identify potential support and resistance zones.
Recognizing these patterns can enhance your day trading strategy by improving entry and exit timing.
How do volume levels relate to support and resistance?
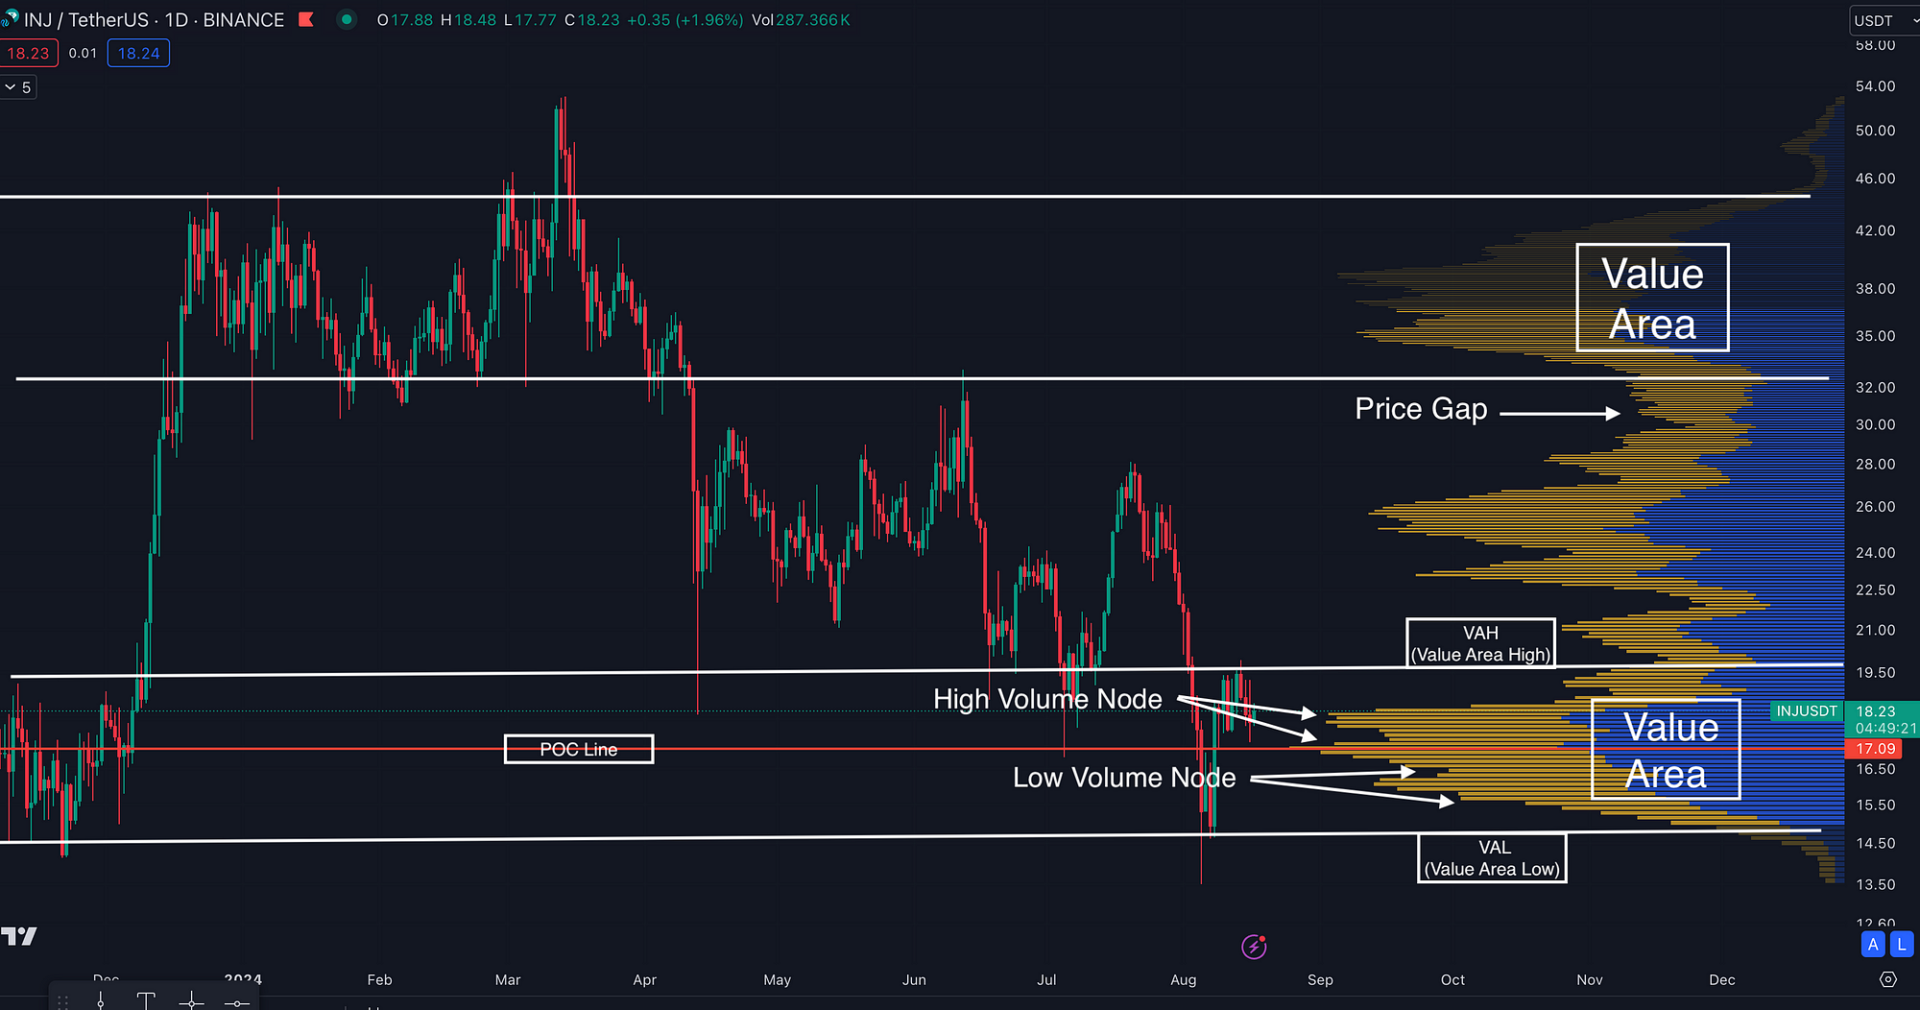
Volume levels are crucial for identifying support and resistance in day trading. High volume at a price level often indicates strong support or resistance, as it shows significant interest from traders. When the price approaches a level with high volume, it’s more likely to bounce back (support) or reverse (resistance). Conversely, low volume at a price level suggests weak support or resistance, making it easier for the price to break through. Monitoring volume alongside price movements helps traders confirm the validity of these levels.
How can I identify support and resistance in volatile markets?
To identify support and resistance in volatile markets, focus on these key methods:
1. Recent Highs and Lows: Look at the last few days' price movements. Peaks indicate resistance, while troughs indicate support.
2. Trend Lines: Draw lines connecting consecutive highs or lows. These lines can reveal potential support and resistance levels.
3. Moving Averages: Use short-term moving averages (like the 20-day) to spot dynamic support and resistance areas.
4. Fibonacci Retracement: Apply Fibonacci levels to identify potential reversal points. These can serve as support or resistance.
5. Volume Profile: Analyze volume at different price levels. High volume around certain prices often indicates strong support or resistance.
6. Psychological Levels: Watch round numbers (like $50, $100) as they often act as support or resistance due to trader psychology.
7. Market Sentiment: Pay attention to news and events. They can shift support and resistance levels quickly in volatile markets.
Use these techniques together for a clearer picture of where support and resistance may lie.
Learn about How to Identify Support and Resistance on Charts
What are the best timeframes for spotting support and resistance?
The best timeframes for spotting support and resistance in day trading are typically the 1-minute, 5-minute, and 15-minute charts. These shorter timeframes allow traders to identify key levels quickly and react to market movements. Additionally, the 30-minute and hourly charts can provide a broader perspective, helping to confirm those levels. Use these timeframes to analyze price action and volume for more accurate support and resistance identification.
How can news events impact support and resistance levels?
News events can significantly impact support and resistance levels by causing sudden price movements. Positive news may break resistance levels as traders rush to buy, while negative news can push prices below support levels as selling pressure increases. For example, an earnings surprise can lead to a rapid increase in buying, establishing a new resistance point. Conversely, unfavorable economic data can invalidate existing support, prompting traders to adjust their strategies. Monitoring news events is crucial for day traders to anticipate potential shifts in these key levels.
Learn about How do gaps and sudden news impact risk levels?
What strategies can I use with support and resistance in day trading?
Use the following strategies for identifying support and resistance levels in day trading:
1. Trendlines: Draw trendlines to visualize support and resistance. Connect recent highs or lows to spot potential reversal points.
2. Moving Averages: Apply moving averages (like the 50-day or 200-day) to act as dynamic support or resistance. Price often reacts around these averages.
3. Fibonacci Retracement: Use Fibonacci levels to identify potential reversal zones. Traders often buy near 38.2% or 61.8% retracement levels.
4. Previous Highs and Lows: Mark previous day’s highs and lows. These levels often serve as support or resistance on the current day.
5. Volume Profile: Analyze volume at different price levels. High volume areas can indicate strong support or resistance.
6. Candlestick Patterns: Look for reversal patterns like pin bars or engulfing patterns at key support and resistance zones to confirm trades.
7. Round Numbers: Pay attention to psychological levels (like 50, 100). Traders often react to these numbers, making them strong support or resistance.
Implement these strategies to enhance your day trading effectiveness around support and resistance levels.
Learn about How to use hedging strategies in day trading?
How can backtesting improve my understanding of support and resistance?
Backtesting allows you to analyze historical price data to see how well support and resistance levels would have performed in past trades. By applying your strategies to historical charts, you can identify which levels consistently acted as support or resistance. This helps you refine your understanding of price action, enhance your trading strategy, and build confidence in your decision-making. You’ll also learn to recognize patterns and improve your ability to predict future price movements based on past behavior.
What mistakes should I avoid when trading support and resistance levels?
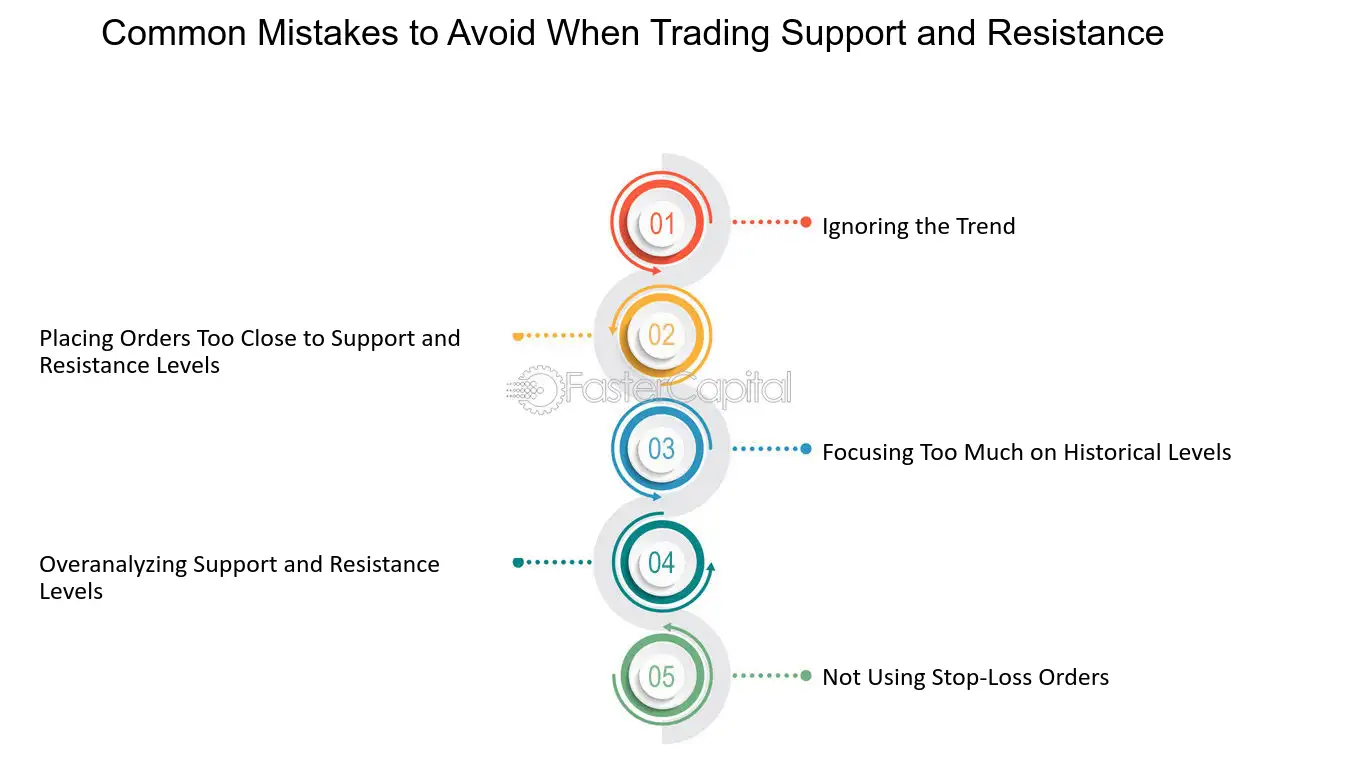
Avoid these mistakes when trading support and resistance levels:
1. Ignoring Market Context: Always consider the overall trend. Trading against a strong trend can lead to losses.
2. Entrusting Only Technical Indicators: Relying solely on indicators without understanding price action can mislead your trades.
3. Not Confirming Breakouts: Entering trades on breakouts without confirmation can result in false signals. Wait for a retest or confirmation candle.
4. Setting Tight Stop Losses: Placing stop losses too close can result in premature exits. Give your trades room to breathe.
5. Overtrading: Trading every support and resistance level can lead to losses. Focus on high-probability setups.
6. Ignoring Volume: Low volume at support or resistance levels can indicate weak levels. Pay attention to volume for confirmation.
7. Failing to Adapt: Markets change; be ready to adjust your levels as new data comes in. Static levels can become irrelevant.
8. Not Using Multiple Time Frames: Relying on one time frame can skew your view. Check higher time frames for stronger support and resistance.
Avoid these pitfalls to improve your trading success with support and resistance levels.
Conclusion about Identifying Support and Resistance Levels in Day Trading
In summary, understanding support and resistance levels is crucial for effective day trading. These concepts not only guide trading decisions but also enhance strategy formulation through various tools and analysis techniques. By mastering these elements, traders can better navigate market volatility, optimize entry and exit points, and improve overall performance. With the insights and resources from DayTradingBusiness, you'll be well-equipped to leverage support and resistance in your trading endeavors.
Learn about Identifying Support and Resistance Levels with Order Flow