Did you know that some traders have a better chance of finding a unicorn than correctly predicting market reversals without proper analysis? In the world of trading, mastering the combination of technical analysis and reversal strategies is crucial for success. This article dives into the essentials of technical analysis, explores how reversal strategies function, and highlights key indicators and patterns that signal potential market turns. Additionally, it discusses the significance of support and resistance levels, candlestick patterns, and volume in identifying reversals. With insights on risk management and the best tools for analysis, DayTradingBusiness provides a comprehensive guide to enhance your trading strategy. Get ready to sharpen your trading skills and navigate market fluctuations with confidence!
What is Technical Analysis in Trading?
Technical analysis in trading involves using historical price data and trading volumes to forecast future price movements. When combining technical analysis with reversal strategies, traders look for patterns or indicators that signal potential trend reversals, such as support and resistance levels, candlestick patterns, or momentum indicators. This approach helps identify opportune moments to enter or exit trades, maximizing profit while minimizing risk.
How do Reversal Strategies Work in Trading?
Reversal strategies in trading aim to identify points where a trend is likely to change direction. They combine technical analysis tools—like support and resistance levels, candlestick patterns, and momentum indicators—to pinpoint these reversal points.
Traders look for signs of exhaustion in the current trend. For instance, if a stock is in a strong uptrend but shows bearish divergence on the RSI (Relative Strength Index), it may indicate a reversal. Similarly, a bullish hammer candlestick at support can signal a potential trend change to the upside.
Entry points are typically set just after confirmation of the reversal pattern, while stop-loss orders are placed beyond the last swing high or low to manage risk. By combining these technical analysis elements, traders can effectively capitalize on trend reversals.
What are the Key Indicators in Technical Analysis?
Key indicators in technical analysis include moving averages, Relative Strength Index (RSI), MACD (Moving Average Convergence Divergence), Bollinger Bands, and Fibonacci retracement levels. For reversal strategies, focus on indicators like RSI for overbought/oversold conditions, MACD crossovers for trend shifts, and candlestick patterns like hammers or engulfing patterns. These tools help identify potential price reversals effectively.
How to Identify Reversal Patterns in Charts?
To identify reversal patterns in charts, look for key formations such as head and shoulders, double tops/bottoms, and bullish/bearish engulfing patterns. Monitor price action and volume; significant changes often signal reversals. Use trendlines to spot breaks that indicate a potential reversal. Confirm patterns with indicators like RSI or MACD for added reliability. Always consider the broader market context to validate your findings.
What is the Role of Support and Resistance in Reversal Strategies?
Support and resistance levels are crucial in reversal strategies as they indicate potential price points where a trend may reverse. Support is where prices tend to stop falling and may bounce back up, while resistance is where prices typically stop rising and may fall. Traders use these levels to identify entry and exit points; for example, a price hitting a strong support level might signal a buying opportunity, while a price nearing resistance could suggest a selling point. By analyzing these levels, traders can enhance their decision-making in reversal scenarios, increasing the chances of successful trades.
How to Combine Technical Analysis with Reversal Signals?
To combine technical analysis with reversal signals, start by identifying key support and resistance levels using trendlines and Fibonacci retracements. Look for price patterns like double tops or bottoms, head and shoulders, and candlestick formations such as engulfing patterns or hammers. Use indicators like RSI or MACD to spot overbought or oversold conditions that suggest potential reversals. Confirm signals by checking volume trends—higher volume on a reversal can strengthen the signal. Finally, always set stop-loss orders to manage risk effectively.
What are Common Reversal Patterns to Look For?
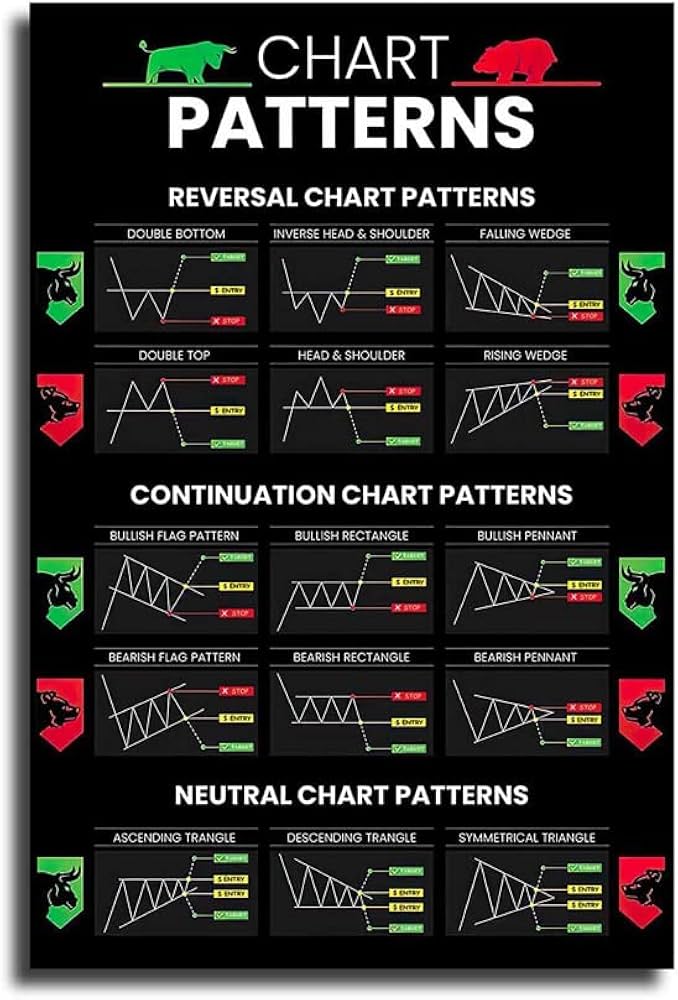
Common reversal patterns include the head and shoulders, double tops and bottoms, and the inverse head and shoulders. The head and shoulders pattern signals a trend reversal from bullish to bearish, while double tops indicate a price peak followed by a downturn. Conversely, double bottoms suggest a price low followed by a bullish trend. The inverse head and shoulders is a strong bullish reversal pattern. Look for these patterns on charts to identify potential changes in market direction.
How to Use Candlestick Patterns for Reversal Analysis?
To use candlestick patterns for reversal analysis, follow these steps:
1. Identify Key Patterns: Look for reversal candlestick patterns like the hammer, shooting star, engulfing patterns, and dojis. These indicate potential price reversals.
2. Confirm with Volume: Check trading volume alongside the pattern. High volume on a reversal pattern strengthens the signal.
3. Look for Support/Resistance: Place patterns near key support or resistance levels. Reversals are more reliable at these points.
4. Use Indicators: Combine candlestick analysis with indicators like RSI or MACD for confirmation. Divergence can signal reversals.
5. Set Entry and Stop-Loss: Plan your entry at the confirmation of the reversal and set a stop-loss just outside the pattern to manage risk.
6. Monitor Trends: Always consider the overall market trend. A reversal in a strong trend may be less reliable.
By applying these steps, you can effectively analyze reversals using candlestick patterns in your trading strategy.
What is the Importance of Volume in Reversal Strategies?
Volume is critical in reversal strategies as it confirms the strength of a price move. High volume during a reversal signals strong interest and validates the shift in trend. When prices change direction on low volume, the reversal may lack conviction and be more likely to fail. Additionally, volume can provide early warning signs of potential reversals, allowing traders to enter positions at optimal times. Monitoring volume alongside price action enhances the reliability of reversal strategies in technical analysis.
How can Moving Averages Enhance Reversal Strategies?

Moving averages can enhance reversal strategies by providing clear trend direction and identifying potential reversal points. A crossover of short-term and long-term moving averages can signal shifts in momentum. For example, if a short-term moving average crosses below a long-term average, it may indicate a bearish reversal. Additionally, combining moving averages with support and resistance levels can help traders confirm reversals, increasing the strategy's effectiveness. Using these tools together allows for more informed decisions and improved entry and exit points in reversal trading.
What are the Best Time Frames for Applying Reversal Strategies?
The best time frames for applying reversal strategies typically range from 1-hour to daily charts. Shorter time frames like 15-minute and 30-minute can capture quick reversals, while daily charts provide more reliable signals over longer trends. Traders often combine these time frames for better confirmation, using shorter ones for entry points and longer ones for overall trend analysis.
How to Manage Risk with Reversal Trading Strategies?
To manage risk with reversal trading strategies, start by identifying key support and resistance levels using technical analysis. Use indicators like RSI or MACD to spot overbought or oversold conditions that suggest a potential reversal.
Set tight stop-loss orders to limit potential losses, placing them just beyond the identified levels. Position sizing is crucial; only risk a small percentage of your capital on each trade.
Consider using a risk-reward ratio of at least 1:2 to ensure that potential gains outweigh the risks. Regularly review and adjust your strategy based on market conditions to stay agile and minimize losses.
Learn about How to evaluate leverage risk in day trading strategies?
What Tools Can Help in Technical Analysis for Reversals?
Tools that can help in technical analysis for reversals include:
1. Candlestick Patterns: Look for formations like doji, hammer, or engulfing patterns that signal potential reversals.
2. Support and Resistance Levels: Identify key price levels where reversals historically occur.
3. Moving Averages: Use crossovers, like the 50-day and 200-day, to spot trend reversals.
4. Relative Strength Index (RSI): An RSI above 70 suggests overbought conditions, while below 30 indicates oversold, signaling potential reversals.
5. MACD (Moving Average Convergence Divergence): Watch for MACD crossovers and divergences for reversal signals.
6. Fibonacci Retracement: Use Fibonacci levels to identify potential reversal zones.
7. Volume Analysis: Increased volume during a reversal can confirm the strength of the move.
Combining these tools effectively enhances your ability to spot potential reversal opportunities in the market.
How to Backtest Reversal Strategies Using Technical Analysis?
To backtest reversal strategies using technical analysis, follow these steps:
1. Select Indicators: Choose indicators that signal reversals, like RSI, MACD, or candlestick patterns.
2. Define Entry and Exit Rules: Clearly when to enter and exit trades based on your indicators. For example, buy when RSI is below 30 and sell when it rises above 70.
3. Gather Historical Data: Obtain historical price data for the asset you want to test. Ensure it includes enough data points for reliability.
4. Use Backtesting Software: Utilize platforms like TradingView or MetaTrader to input your strategy. Program your rules into the software.
5. Run the Backtest: Execute the backtest over your chosen timeframe. Analyze trade outcomes, win rates, and drawdowns.
6. Analyze Results: Review metrics such as profit factor, maximum drawdown, and consistency. Adjust your strategy based on findings.
7. Optimize: Fine-tune your strategy by modifying indicators or rules and retest to improve performance.
This method helps validate your reversal strategy's effectiveness before live trading.
Learn about How to Backtest Your Reversal Strategies
What Mistakes to Avoid When Combining Technical Analysis with Reversals?
When combining technical analysis with reversal strategies, avoid these mistakes:
1. Ignoring Confirmation: Don’t act solely on reversal patterns without confirming signals from indicators like RSI or MACD.
2. Overtrading: Resist the urge to enter trades on every reversal signal. Wait for strong setups.
3. Neglecting Risk Management: Always set stop-loss orders to protect against unexpected moves.
4. Misjudging Market Context: Consider the broader trend; reversals are less reliable in strong trends.
5. Overcomplicating Analysis: Stick to a few key indicators instead of cluttering your charts with too many tools.
6. Failing to Analyze Volume: Low volume on a reversal signal can indicate a lack of conviction; always check volume trends.
7. Ignoring Market News: External factors can invalidate reversal signals—stay informed on relevant news.
8. Disregarding Timeframes: Ensure your analysis aligns across multiple timeframes for better accuracy.
How Can Technical Analysis Enhance Day Trading Reversal Strategies?
To effectively combine technical analysis with reversal strategies in day trading, focus on identifying key reversal patterns, such as double tops and bottoms, using indicators like RSI or MACD for confirmation. Look for support and resistance levels to establish entry and exit points, ensuring that volume supports the reversal signal.
Learn more about: Understanding Day Trading Reversal Strategies
Learn about How to Combine Fundamental and Technical Analysis in Day Trading
How to Stay Disciplined While Using Reversal Strategies in Trading?
To stay disciplined while using reversal strategies in trading, follow these key steps:
1. Set Clear Entry and Exit Points: Define precise levels where you'll enter and exit trades based on your technical analysis.
2. Use Stop Losses: Always implement stop-loss orders to manage risk and prevent emotional decision-making.
3. Stick to Your Plan: Create a trading plan that outlines your strategy and adhere to it strictly, avoiding impulsive changes.
4. Limit Position Sizes: Control your risk by limiting the size of each trade to a small percentage of your total capital.
5. Analyze Market Conditions: Continuously assess market trends and sentiment to ensure your reversal strategy remains relevant.
6. Review and Adjust: Regularly evaluate your trades and strategies, making adjustments based on performance without deviating from your core principles.
By combining these practices with technical analysis, you can enhance your discipline in executing reversal strategies effectively.
Learn about How to Stay Disciplined While Day Trading Scalping
Conclusion about Combining Technical Analysis with Reversal Strategies
Incorporating technical analysis with reversal strategies can significantly enhance your trading outcomes. By understanding key indicators, recognizing reversal patterns, and leveraging support and resistance levels, traders can make informed decisions. Utilizing candlestick patterns and volume analysis further refines these strategies, while moving averages help in identifying trends. Effective risk management and discipline are crucial to success. For those looking to deepen their trading skills, DayTradingBusiness offers valuable insights and resources to guide you on this journey.
Learn about Combining Breakout Strategies with Technical Analysis