Did you know that a stock’s volume can sometimes speak louder than its price? In the world of trading, understanding volume is crucial for successful breakout strategies. This article dives into the significance of volume, detailing how to measure it, its role in confirming breakout signals, and the impact it has on trend reversals. You’ll learn about key indicators, essential volume patterns, and how to analyze volume effectively before a breakout occurs. Additionally, we’ll discuss common pitfalls traders encounter and how mastering volume analysis can enhance your overall trading decisions. With insights from DayTradingBusiness, you’ll be better equipped to navigate the dynamic landscape of breakout trading.
What is Volume in Breakout Strategies?
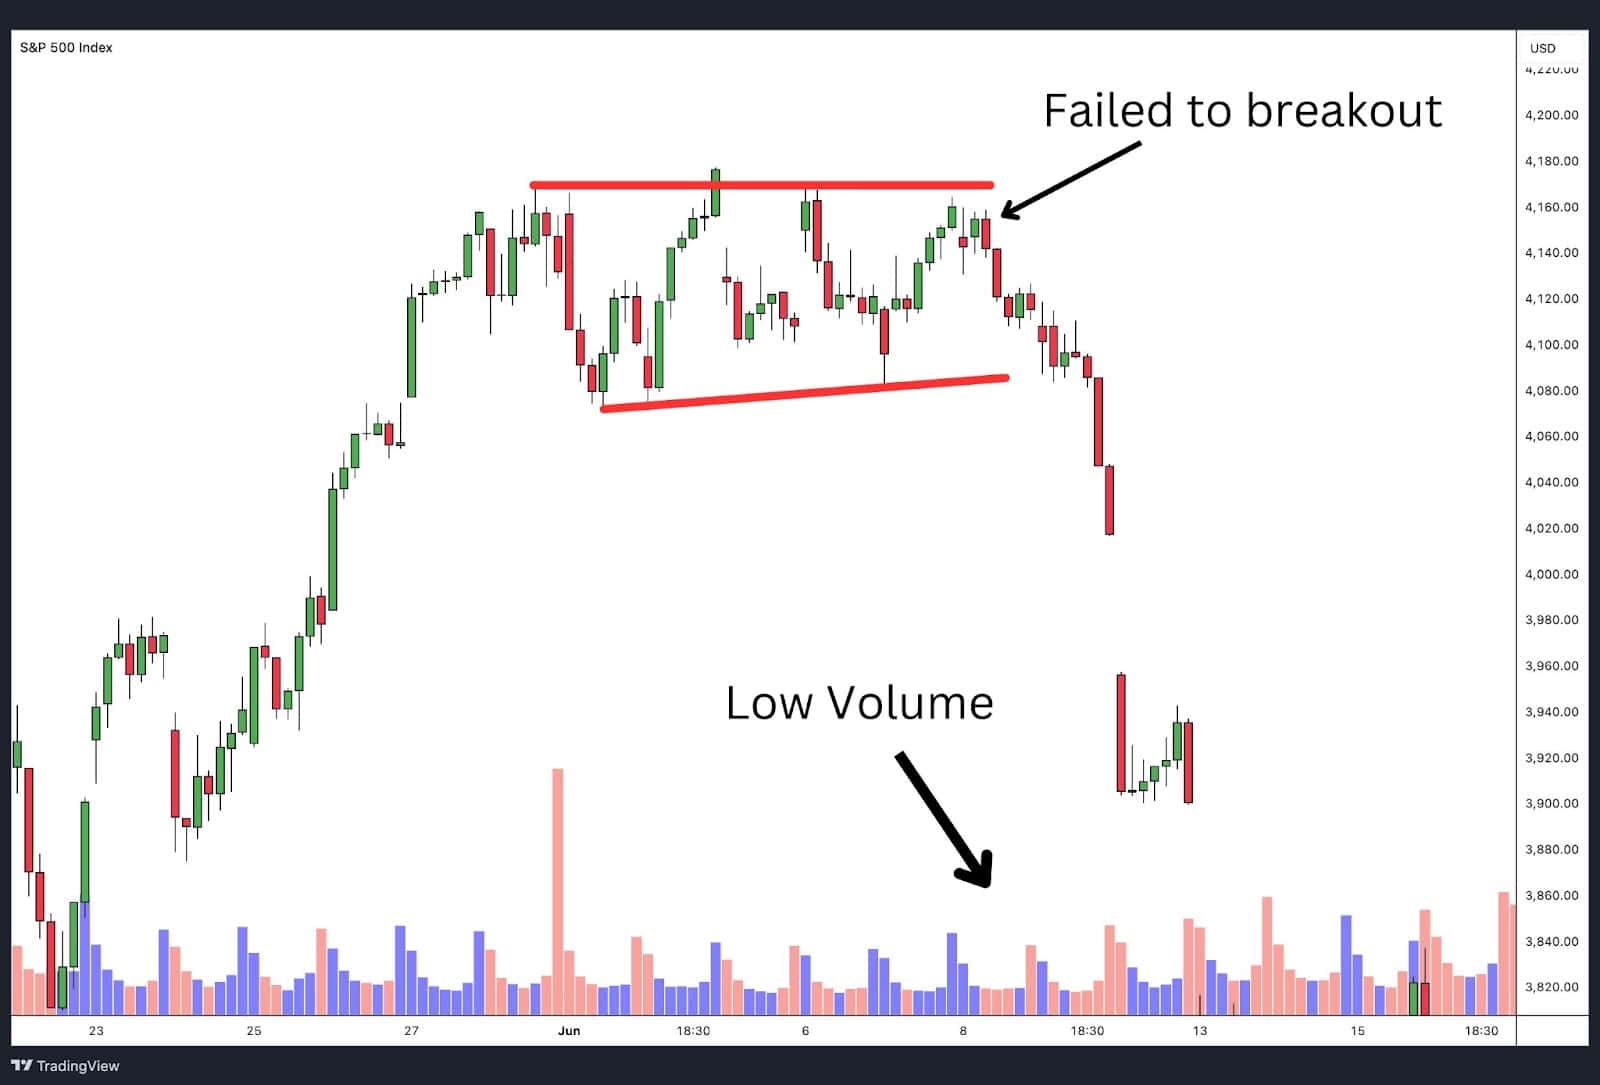
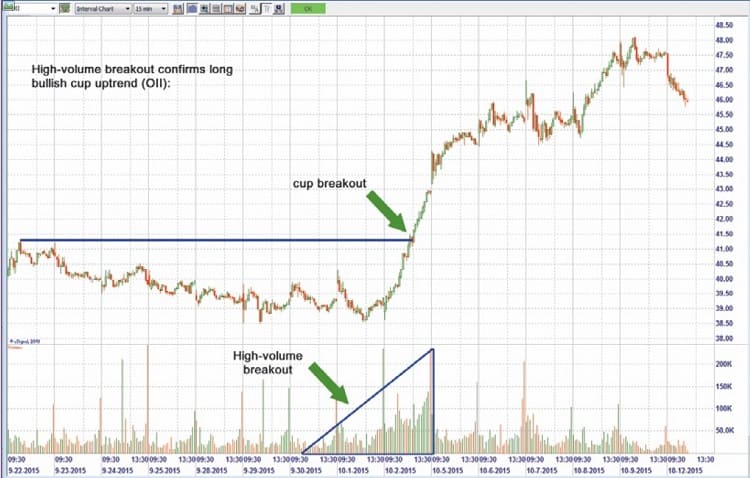
Volume in breakout strategies refers to the number of shares or contracts traded during a specific period when the price breaks through a support or resistance level. High volume during a breakout indicates strong interest and validates the move, suggesting it’s more likely to continue. Conversely, low volume may signal a false breakout, where the price could reverse. Traders often look for volume spikes to confirm the strength of a breakout and increase the probability of successful trades.
How to Measure Volume for Breakouts?
To measure volume for breakouts, follow these steps:
1. Identify the Breakout Point: Determine the price level where the asset is expected to break out, typically above resistance or below support.
2. Check Volume Levels: Look for a significant increase in trading volume as the price approaches the breakout point. A spike of 30% or more above the average volume is a good indicator.
3. Use Volume Indicators: Utilize tools like the Volume Moving Average or the On-Balance Volume (OBV) to confirm trends. A rising OBV indicates stronger buying pressure.
4. Confirm with Price Action: Ensure the breakout is accompanied by a strong price movement. Ideally, the asset should close above the breakout level on high volume.
5. Monitor Subsequent Volume: After the breakout, sustained volume should continue to indicate momentum. A drop in volume can signal a potential reversal.
By analyzing these factors, you can effectively gauge volume for breakout strategies.
Why is Volume Important in Breakout Trading?
Volume is crucial in breakout trading because it confirms the strength of a price movement. High volume during a breakout indicates strong buying or selling interest, increasing the likelihood that the price will continue in that direction. Low volume, on the other hand, can signal a false breakout, where the price may quickly reverse. Traders often look for volume spikes as a key indicator of real momentum and sustainability in a breakout.
What Are the Key Indicators of Volume in Breakouts?
Key indicators of volume in breakouts include:
1. Increased Volume: Look for a significant spike in trading volume during the breakout. This indicates strong interest and momentum.
2. Volume Confirmation: Ensure volume on the breakout day exceeds the average volume of the prior days. This confirms the strength of the move.
3. Volume Surge on Breakout: Ideally, volume should double or triple the average to validate the breakout’s reliability.
4. Volume Patterns: Analyze volume trends leading up to the breakout. A buildup of volume in a consolidation phase can signal an impending breakout.
5. Follow-Through Volume: After the initial breakout, continued high volume on subsequent days reinforces the breakout’s validity.
Monitoring these indicators helps assess the strength and sustainability of price movements in breakout strategies.
How Does Volume Confirm Breakout Signals?
Volume confirms breakout signals by showing increased trading activity during the breakout. When the price moves above a resistance level or below a support level, a surge in volume indicates strong interest and commitment from traders. Higher volume suggests that the breakout is likely to be sustained rather than a false signal. For example, if a stock breaks out of a resistance level with double the average volume, it reinforces the validity of the breakout. Conversely, low volume during a breakout may signal a lack of conviction, suggesting a potential reversal.
What Role Does Volume Play in Trend Reversals?
Volume is crucial in trend reversals as it indicates the strength of a price movement. High volume during a reversal suggests strong conviction among traders, signaling a potential change in trend. If a price move occurs on low volume, it may lack sustainability, increasing the likelihood of a false breakout. Analyzing volume alongside price action helps confirm the legitimacy of the reversal, enhancing the effectiveness of breakout strategies.
How to Use Volume in Different Breakout Strategies?
To effectively use volume in different breakout strategies, follow these steps:
1. Confirm Breakouts: Look for increased volume when the price breaks key resistance or support levels. A strong breakout occurs with volume at least 50% higher than the average.
2. Validate Trends: Use volume to confirm the direction of a breakout. Rising volume with a price increase indicates bullish sentiment, while rising volume with a price decrease suggests bearish sentiment.
3. Identify False Breakouts: Watch for low volume during breakouts, which can indicate a lack of conviction and possible reversals.
4. Volume Patterns: Look for volume patterns like accumulation (increasing volume in uptrends) or distribution (increasing volume in downtrends) to gauge market sentiment before executing trades.
5. Combine with Technical Indicators: Use volume alongside indicators like Moving Averages or RSI to strengthen your breakout analysis and decision-making.
By focusing on these aspects, you can effectively incorporate volume into your breakout strategies for better trading outcomes.
What Volume Patterns Should Traders Look For?
Traders should look for three main volume patterns in breakout strategies:
1. High Volume Breakouts: A surge in volume accompanying a price breakout indicates strong interest and confirms the move. This often suggests a continuation of the trend.
2. Volume Spikes: Sudden increases in volume during a consolidation phase can signal an impending breakout. Look for these spikes to identify potential entry points.
3. Volume Drying Up: Decreasing volume during a price consolidation can signal an upcoming breakout. If price holds steady while volume declines, a breakout may follow.
Focusing on these patterns helps traders make informed decisions in breakout scenarios.
How Can Low Volume Affect Breakout Success?
Low volume can lead to weak breakout success because it indicates less interest and participation from traders. When a breakout occurs on low volume, it may lack the necessary momentum to sustain price movement, making it more susceptible to false signals and reversals. In contrast, high volume during a breakout shows strong conviction, increasing the likelihood of a successful continuation. Therefore, always consider volume alongside breakouts to gauge their reliability.
What Are the Best Volume Indicators for Breakouts?
The best volume indicators for breakouts include:
1. Volume Spike: A sudden increase in volume during a price breakout indicates strong interest and potential for continuation.
2. On-Balance Volume (OBV): This indicator combines price movement and volume to show buying or selling pressure. A rising OBV alongside a breakout confirms strength.
3. Accumulation/Distribution Line: This measures the cumulative flow of money into and out of a security, helping identify whether a breakout is supported by buying pressure.
4. Chaikin Money Flow (CMF): It combines price and volume over a specific period, indicating whether a stock is being accumulated or distributed.
5. Average Volume: Compare current volume against a moving average. A breakout with volume significantly above the average signals a high probability of continuation.
Using these indicators can enhance your breakout strategy by confirming the strength and validity of the move.
How to Analyze Volume Before a Breakout?

To analyze volume before a breakout, follow these steps:
1. Observe Volume Trends: Look for increasing volume as the price approaches key resistance levels. This indicates growing interest.
2. Use Volume Indicators: Employ tools like On-Balance Volume (OBV) or the Volume Moving Average to confirm trends. Rising OBV with price suggests a potential breakout.
3. Check Historical Volume: Compare current volume with historical averages. A spike above the norm can signal a strong breakout.
4. Identify Accumulation or Distribution: Notice if volume increases during price consolidation (accumulation) or declines (distribution). Accumulation often precedes a bullish breakout.
5. Monitor News and Events: Be aware of upcoming news that could influence volume. High-profile announcements can lead to significant volume changes.
6. Look for Volume Clusters: Identify areas where volume spikes occurred previously at similar price levels. These can act as strong breakout points.
By focusing on these aspects, you can better gauge the likelihood of a successful breakout based on volume analysis.
What is the Relationship Between Price and Volume in Breakouts?
In breakout strategies, price and volume have a direct relationship. When a stock breaks out of a resistance level, increased volume typically confirms the breakout, indicating strong buying interest. High volume suggests that the move is likely to sustain, while low volume can signal a false breakout or lack of conviction. Traders often look for volume spikes as a key indicator of potential price momentum in breakouts.
How Does Analyzing Volume Enhance Day Trading Breakout Strategies?
Day trading breakout strategies involve entering trades when the price of a stock moves above a defined resistance level with increased volume. Analyzing volume is crucial; higher volume during a breakout confirms the strength of the move and suggests potential continuation. Look for volume spikes that exceed the average volume, as this indicates strong interest and validates the breakout. A lack of volume may signal a false breakout, making it essential to assess volume trends alongside price movements.
Learn more about: What Are Day Trading Breakout Strategies?
Learn about How Do Prop Firms Affect Day Trading Strategies?
How to Interpret High Volume During Breakouts?
High volume during breakouts often indicates strong buyer interest and confirms the validity of the price movement. It suggests that the breakout is likely to continue, as more traders are entering the market. Conversely, low volume during a breakout may signal a lack of conviction, raising the risk of a false breakout. Look for volume that significantly exceeds the average, as this reinforces the strength of the trend. Always consider the context of the breakout and check for any news or events that may be influencing trading activity.
What Common Mistakes Do Traders Make with Volume Analysis?
Traders often make several common mistakes with volume analysis in breakout strategies. One mistake is relying solely on volume spikes without considering price action. Another is ignoring the context of volume relative to historical averages, which can mislead interpretations. Additionally, some traders enter positions too early, mistaking preliminary volume increases as confirmation of a breakout. Failing to distinguish between genuine breakouts and false signals due to low volume is another critical error. Lastly, not using volume in conjunction with other indicators can lead to missed opportunities or increased risk.
How Can Volume Analysis Improve Trading Decisions?
Volume analysis can significantly enhance trading decisions in breakout strategies by confirming price movements. When a breakout occurs with high volume, it indicates strong investor interest, suggesting the price trend is likely to continue. Conversely, if a breakout happens on low volume, it may signal a false move, leading to potential losses.
Traders can use volume indicators, like the Volume Weighted Average Price (VWAP), to gauge the strength of a breakout. Additionally, monitoring volume spikes can help identify key support and resistance levels, allowing traders to set more effective entry and exit points. Overall, integrating volume analysis helps traders make informed decisions, reducing risk and increasing the likelihood of successful trades.
Learn about How to Use Volume to Improve Day Trading
Conclusion about Analyzing Volume in Breakout Strategies
In summary, understanding volume is crucial for successful breakout strategies. It serves as a key indicator of market momentum, confirming the strength of breakout signals and aiding in identifying potential trend reversals. By analyzing volume patterns and using appropriate indicators, traders can enhance their decision-making processes and improve the likelihood of successful trades. Leveraging insights from DayTradingBusiness can further refine your volume analysis and elevate your trading strategies.