Did you know that some traders spend more time choosing their day trading software than they do actually trading? In the fast-paced world of day trading, having the right software for technical analysis can make or break your success. This article dives deep into what day trading software entails, how to choose the best tools, and essential features to look for. We’ll also explore the accuracy of technical analysis indicators, the possibility of using free software, and the leading platforms with advanced technical charts. Plus, you'll learn how to set up and automate your analysis, interpret candlestick charts, and backtest strategies effectively. Don’t forget the risks involved and the common pitfalls to avoid. By leveraging the insights from DayTradingBusiness, you can elevate your day trading game and make informed decisions that lead to success.
What is day trading software for technical analysis?
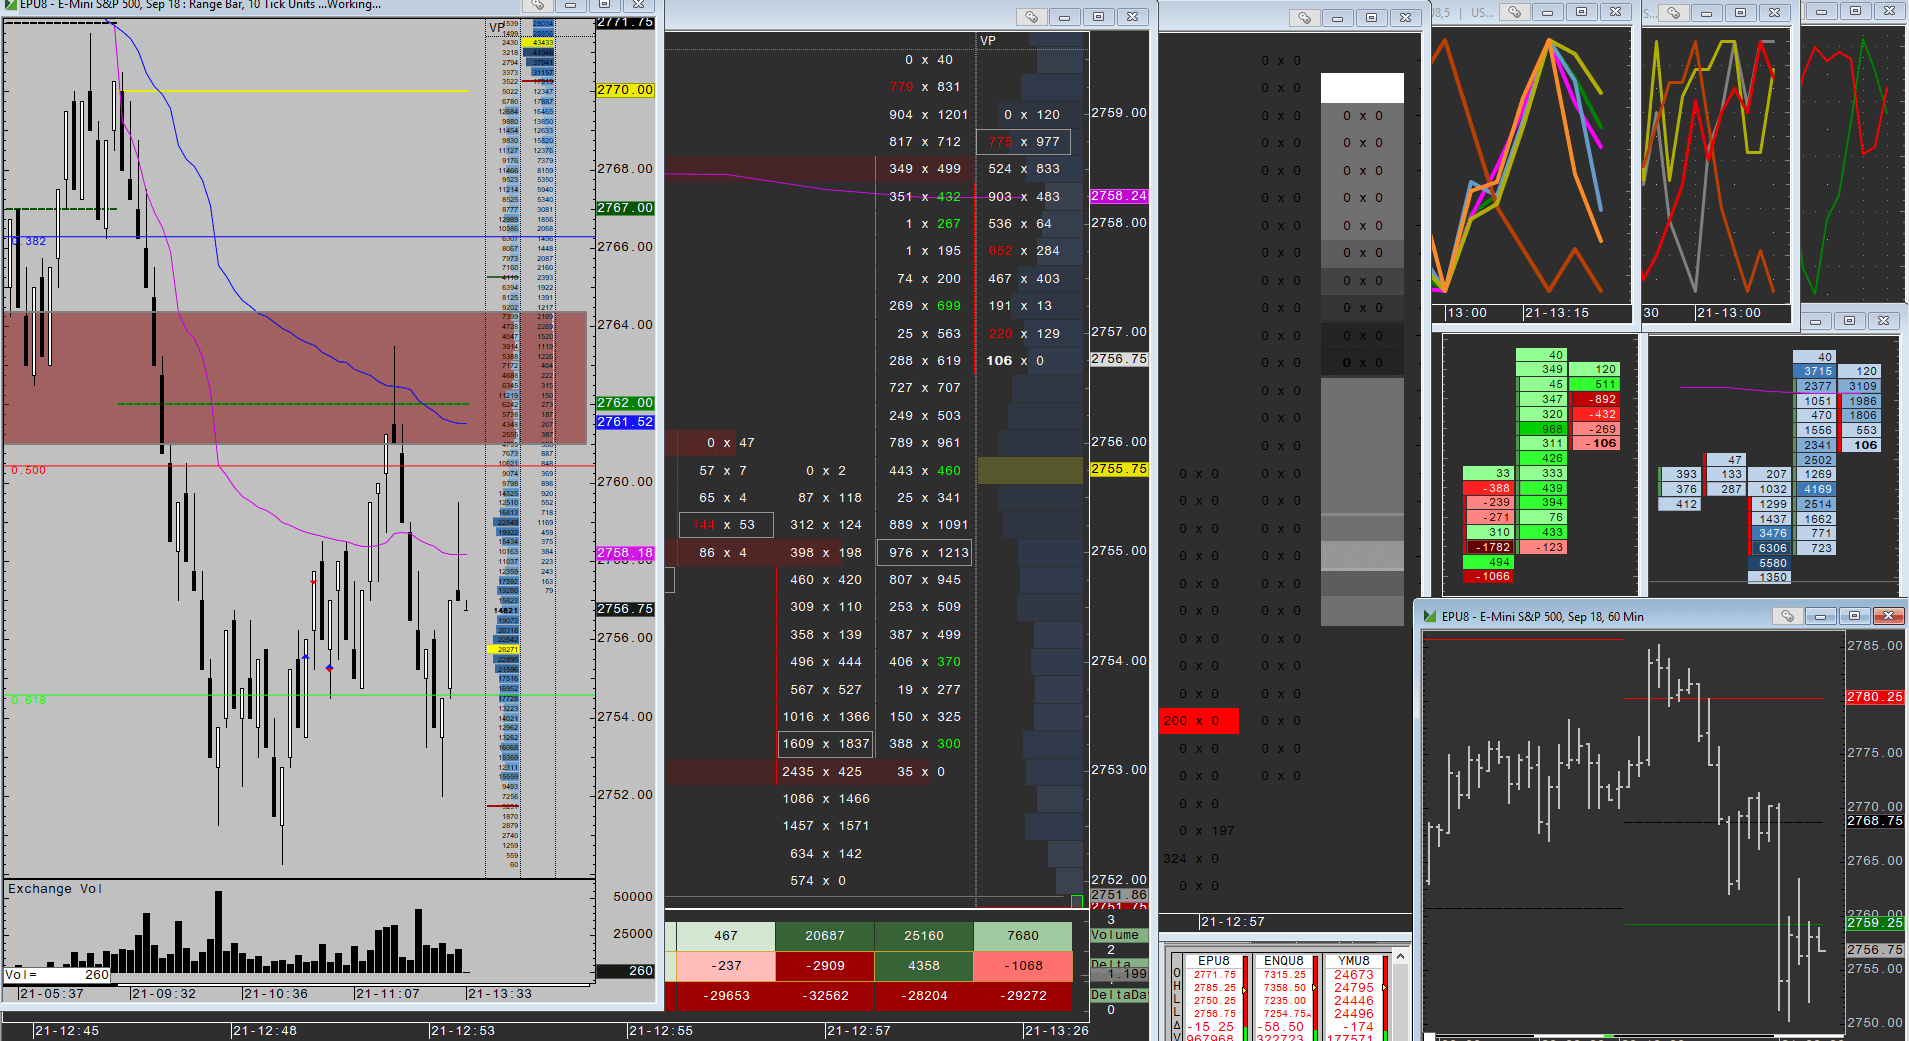
Day trading software for technical analysis are tools designed to help traders analyze price charts, identify trends, and make quick buy/sell decisions. They offer real-time data, charting features, indicators like RSI and moving averages, and customizable setups. Examples include TradingView, ThinkorSwim, and MetaTrader 4. These platforms streamline technical analysis to spot entry and exit points during rapid market moves.
How do I choose the best day trading software?
Choose day trading software with robust technical analysis tools like advanced charting, real-time data, and customizable indicators. Look for platforms that offer fast execution, low latency, and reliable connectivity. Prioritize user-friendly interfaces and features like backtesting and alerts. Check reviews for stability and customer support. Consider whether the software integrates with your preferred broker and supports mobile access.
Which features should I look for in day trading tools?
Look for real-time charting, customizable indicators, quick order execution, and reliable data feeds. A user-friendly interface and advanced technical analysis tools like pattern recognition and automated alerts are essential. Ensure it offers backtesting capabilities and integration with your broker. Low latency and robust security also matter for swift, safe trades.
How accurate are technical analysis indicators?
Technical analysis indicators are generally accurate in identifying trends and potential entry or exit points, but they are not foolproof. They work best when combined with price action, volume, and other tools. Market conditions, news, and unexpected events can still cause false signals. Always verify signals with multiple indicators and consider risk management.
Can I use free software for day trading analysis?
Yes, you can use free software for day trading analysis. Many platforms like TradingView, Thinkorswim (by TD Ameritrade), and MetaTrader offer free versions with essential technical analysis tools. They provide real-time charts, indicators, and scanning features suitable for day trading. However, advanced analytics or faster data feeds may require paid subscriptions.
What are the top day trading platforms with technical charts?
Top day trading platforms with technical charts include Thinkorswim, TradingView, MetaTrader 4 and 5, NinjaTrader, and eToro.
How do I set up technical analysis in trading software?
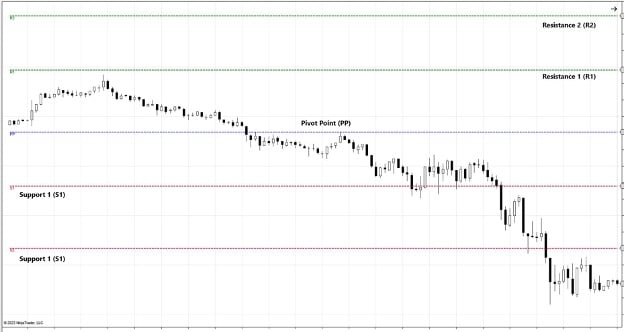
Open your trading software and locate the charting tools. Select the asset you want to analyze. Add technical indicators like moving averages, RSI, or MACD from the indicator menu. Draw trendlines, support, and resistance levels directly on the chart. Customize timeframes to see short-term or long-term trends. Save your setup as a template for quick access in future trades.
Is it easy to learn technical analysis with trading software?
Yes, many trading software tools have user-friendly interfaces and built-in tutorials, making it easier to learn technical analysis. However, mastering it still requires practice, understanding chart patterns, and interpreting indicators.
Which indicators are essential for day trading?
Essential indicators for day trading include moving averages, RSI, MACD, Bollinger Bands, and volume. These tools help identify trend direction, entry and exit points, and overbought or oversold conditions quickly.
How do I interpret candlestick charts for day trading?
Look for patterns like dojis, hammer, or engulfing candles to spot reversals or continuations. Check the candlestick color to gauge momentum—green for bullish, red for bearish. Use candlestick size to assess strength—long bodies indicate strong moves, small bodies show indecision. Combine candlestick signals with volume to confirm trades. Identify key support and resistance levels around candlestick formations. Recognize trends by analyzing sequences of candles—uptrends have consecutive green candles, downtrends show reds. Use candlestick patterns within your day trading software’s technical analysis tools to time entries and exits precisely.
Can I automate technical analysis in trading software?
Yes, you can automate technical analysis in trading software. Many day trading platforms offer built-in tools or APIs to create custom algorithms that analyze charts, indicators, and signals automatically. Automated technical analysis helps identify patterns and entry/exit points without manual effort.
What are the risks of relying on technical analysis tools?
Relying on technical analysis tools can lead to false signals, causing you to make poor trades. They might oversimplify market movements, missing key fundamentals or news events. Overconfidence in these tools can lead to ignoring broader market trends or economic factors. Technical indicators can be manipulated or give conflicting signals, increasing confusion. Relying solely on them may cause emotional trading, risking bigger losses.
How do I backtest strategies using trading software?
Open your day trading software, select your strategy, and load historical market data. Use the backtest function to simulate trades based on your strategy’s rules. Review the performance metrics, like profit factor and drawdown, to evaluate effectiveness. Adjust parameters, rerun the backtest, and compare results to refine your approach.
Learn about How to Backtest Day Trading Strategies Effectively
Which software provides real-time data for day trading?
MetaTrader 4 and 5, TradingView, Thinkorswim, NinjaTrader, and Interactive Brokers offer real-time data for day trading and technical analysis.
Learn about Day Trading Software with Real-Time Data
How does technical analysis improve day trading success?
Technical analysis helps day traders identify entry and exit points by analyzing price patterns, volume, and indicators. Day trading software for technical analysis provides real-time charts, trend lines, and signals, making quick decisions easier. It filters out noise and highlights potential turning points, increasing the chances of profitable trades. Using technical analysis tools in software helps traders react faster to market movements and manage risks better.
Learn about How to Improve Your Day Trading Analysis Skills
Are mobile trading apps effective for technical analysis?

Yes, mobile trading apps are effective for technical analysis. They offer real-time charts, indicators, and drawing tools that traders use to identify trends and entry points on the go. Many apps provide customizable layouts and alerts, making technical analysis accessible anywhere. While they might lack some advanced features of desktop platforms, they are suitable for quick decision-making and monitoring markets during day trading.
How often should I update my technical analysis tools?
Update your day trading software for technical analysis weekly or after major market events. Regular updates ensure you get the latest indicators, bug fixes, and data accuracy. Check for updates daily if your platform provides real-time data and tools. Staying current helps you spot trends and avoid outdated analysis.
What are common mistakes to avoid with trading software?
Avoid ignoring backtesting results; it can lead to false confidence. Don’t rely solely on default settings—tweak parameters to fit your strategy. Overtrading on software signals without confirmation causes losses. Neglecting to update or calibrate the software misses market changes. Ignoring risk management features like stop-loss orders increases exposure. Relying on the software without understanding its algorithms leads to misinterpretation. Using outdated or unverified trading software exposes you to errors. Fail to monitor performance metrics; this hampers strategy adjustments. Ignoring market news while trading with technical analysis software causes missed context.
Learn about Common Mistakes in Day Trading Analysis to Avoid
How do I integrate news feeds with technical analysis tools?
Connect news feeds to your day trading software by using APIs or built-in integrations with financial news services like Bloomberg, Reuters, or MarketWatch. Enable real-time news alerts within your technical analysis tools to see breaking news that impacts market trends. Use platforms that support custom news plugins or widgets, so you can filter relevant headlines alongside your charts. Some trading software offers direct integration with news aggregators, allowing you to set alerts for specific keywords or market events. Sync news feeds with your technical indicators to quickly react to market-moving headlines.
Conclusion about Day Trading Software for Technical Analysis
In summary, selecting the right day trading software for technical analysis is crucial for enhancing trading success. Focus on essential features such as real-time data, automation capabilities, and compatibility with various indicators. While free tools can be useful, investing in reputable platforms often yields better results. Remember to continuously update your tools and avoid common pitfalls. With the right resources and guidance from experts at DayTradingBusiness, traders can effectively leverage technical analysis to make informed decisions and improve their performance.
Learn about Using Charting Software for Day Trading Analysis
Sources:
- Gambling and online trading: emerging risks of real-time stock and ...
- Information asymmetry and the profitability of technical analysis ...
- Technical analysis strategy optimization using a machine learning ...
- Technical indicator empowered intelligent strategies to predict stock ...
- Do futures improve genetically trained high-frequency technical ...