Did you know that the average trader spends more time choosing their favorite coffee than analyzing their charts? If only the right indicators could brew profits as easily! In this article, we dive into the essential technical indicators that every day trader should know. Discover the best indicators for quick trading opportunities and learn how to effectively combine moving averages, momentum indicators, and volume metrics to enhance your decision-making. We'll also cover common pitfalls to avoid, the optimal timeframes for analysis, and how to interpret tools like Bollinger Bands and RSI. Plus, find out how to backtest your setups and create a robust trading strategy using custom combinations. With insights from DayTradingBusiness, you’ll be well-equipped to integrate technical indicators into your day trading charts seamlessly.
What are the best technical indicators for day trading?
The best technical indicators for day trading are Moving Averages (especially the 9 and 20 EMA), Relative Strength Index (RSI), Moving Average Convergence Divergence (MACD), Bollinger Bands, and Stochastic Oscillator. These help identify trend direction, overbought/oversold conditions, and entry/exit points. Use them together to confirm signals and adapt to market volatility.
How do I effectively combine moving averages with other indicators?
Use moving averages to identify trend direction, then confirm signals with momentum indicators like RSI or MACD. For example, a crossover of the 50-day and 200-day MA signals trend shifts, while RSI shows overbought or oversold conditions. Combine the trend clarity from moving averages with volume indicators to validate breakouts. Always look for confluence—when multiple indicators align—to improve trade accuracy. Avoid relying on one indicator alone; use moving averages as a foundation and layer in others for confirmation.
Which momentum indicators help identify quick trading opportunities?
Moving Average Convergence Divergence (MACD), Relative Strength Index (RSI), and Stochastic Oscillator help identify quick trading opportunities. MACD signals momentum shifts; RSI shows overbought or oversold conditions; Stochastic reveals potential reversals. These indicators spot short-term moves for fast trades.
How can volume indicators improve my day trading decisions?
Volume indicators reveal the strength behind price moves, helping you spot genuine breakouts or reversals. They confirm whether a price change is backed by traders buying or selling actively. When volume spikes, it signals high interest, making trades more reliable. Using volume alongside price patterns improves entry and exit timing. It prevents false signals by showing whether market enthusiasm supports the movement. For day traders, this means clearer signals and better risk management.
When should I use RSI and MACD together on my charts?
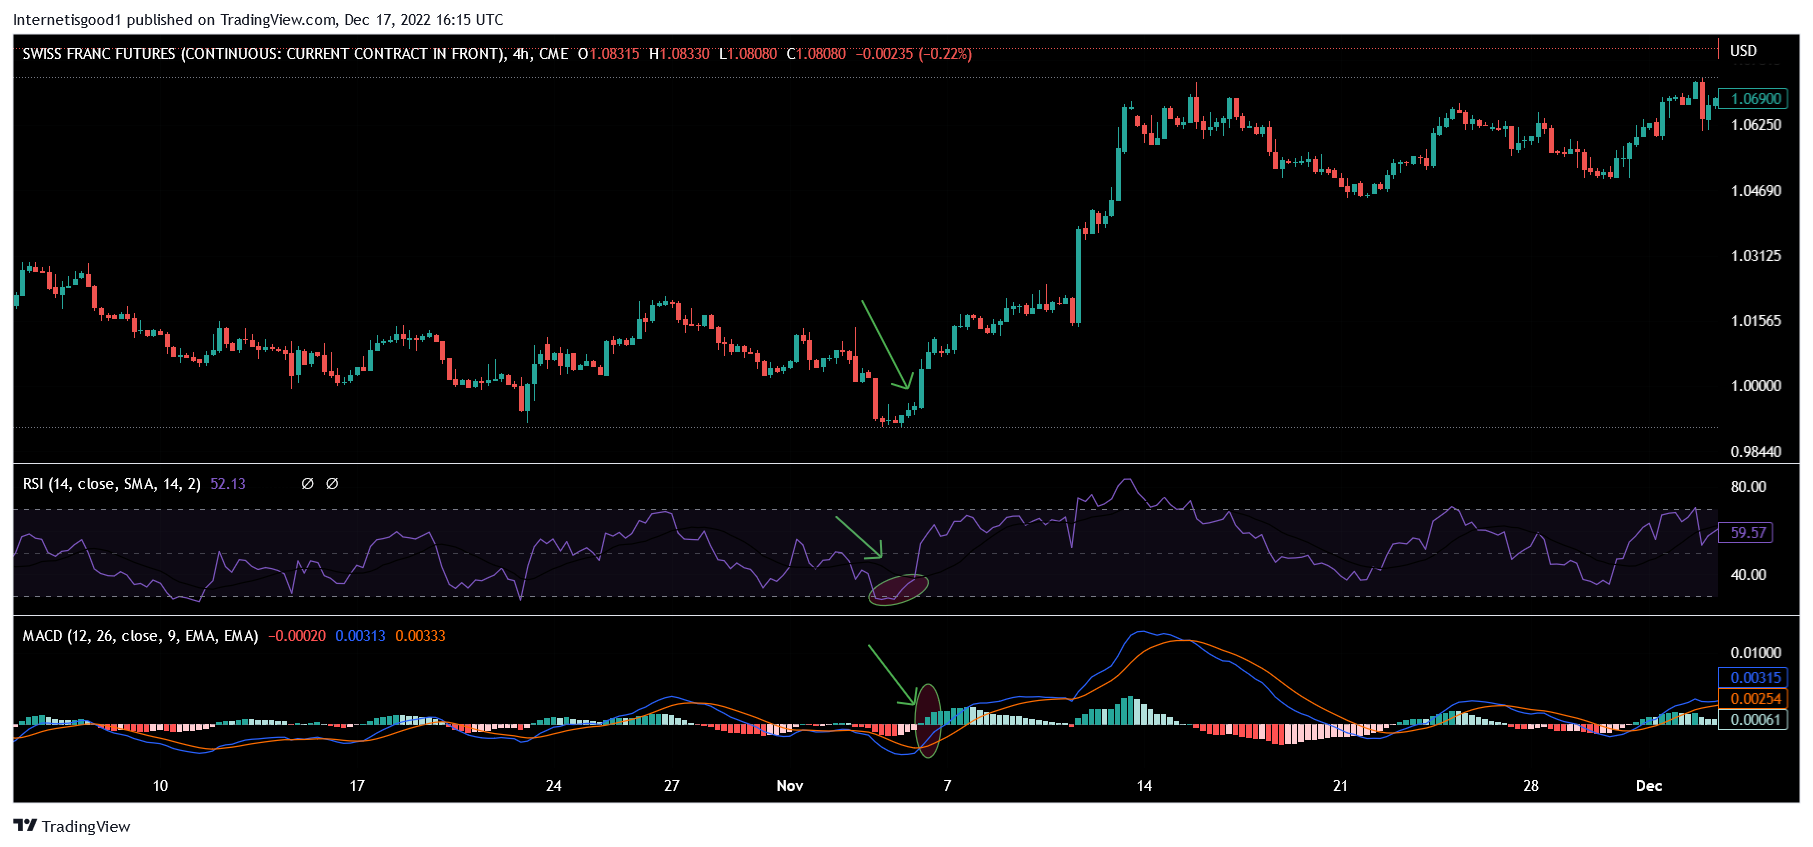
Use RSI and MACD together to confirm trade signals—RSI shows overbought or oversold conditions, while MACD indicates trend momentum. When RSI hits extreme levels (above 70 or below 30) and MACD shows a bullish or bearish crossover, it’s a good entry or exit point. Combine them to avoid false signals—RSI warns of potential reversals, MACD confirms trend direction. Use both during trend reversals, breakouts, or when momentum shifts to increase confidence in your trades.
How do I choose the right timeframes for technical indicators?
Choose timeframes that match your trading style—use shorter periods like 1-minute or 5-minute charts for quick trades, and longer ones like 1-hour or 4-hour charts for broader trends. For day trading, focus on 1-minute to 15-minute charts to spot entry and exit points quickly. Align indicator settings with your chosen timeframe—fast-moving indicators suit shorter charts, while slower ones work better on longer timeframes. Test different timeframes to see which give clearer signals for your strategy. Always consider market volatility; during choppy sessions, shorter timeframes may produce more false signals.
What are common mistakes when integrating technical indicators?
Common mistakes include relying too heavily on a single indicator, ignoring market context, and using outdated or poorly calibrated indicators. Traders often cherry-pick signals, leading to false positives, or neglect to confirm indicators with price action. Overcomplicating charts with too many indicators causes confusion, and not testing indicators thoroughly before trading can lead to poor decisions. Ignoring volume and trend confirmation alongside technical indicators also hampers accuracy.
How do I interpret Bollinger Bands for day trading?
Use Bollinger Bands to spot volatility and price extremes. When the price hits the upper band, it may signal overbought conditions; hitting the lower band suggests oversold. Look for squeeze signals—bands narrowing indicate low volatility, often followed by sharp moves. Breakouts above the upper band can signal strong upward momentum, while breakdowns below the lower band suggest downward moves. Combine with other indicators like RSI or volume for clearer entry and exit points.
Can trend-following indicators help with short-term trades?
Yes, trend-following indicators like moving averages or MACD can help identify short-term price direction, making them useful for quick trades. They signal entry and exit points, helping traders catch uptrends or downtrends early. Using them alongside other tools improves timing and reduces false signals in fast-paced day trading.
How do I avoid false signals from technical indicators?
To avoid false signals, confirm technical indicator signals with multiple tools like moving averages, RSI, and volume. Wait for clear trend confirmation before acting, and avoid overtrading based on single indicator alerts. Use higher timeframes for context and always check for divergence or confirmation candles to filter out noise. Practice patience and develop a trading plan that emphasizes reliability over impulsive moves.
What are the best settings for stochastic oscillators?
Set the stochastic oscillator with a 14-period %K, a 3-period %D, and a 3-period smoothing for %K. Use overbought levels at 80 and oversold at 20. Adjust these based on your trading timeframe—shorter for quick trades, longer for swing trading. Confirm signals with price action or other indicators to reduce false signals.
How do I create a trading strategy using multiple indicators?
Combine indicators that complement each other—like using moving averages to identify trend direction and RSI for overbought or oversold conditions. Set clear entry and exit rules based on indicator signals, such as entering when price crosses a moving average and RSI confirms momentum. Test your strategy with historical data to see how indicators work together, then refine for timing and signal confirmation. Avoid relying on a single indicator; instead, look for consensus among multiple tools to increase confidence. Always include risk management rules to protect your trades.
How can I use Fibonacci retracements alongside other tools?
Use Fibonacci retracements to identify potential support and resistance levels, then confirm these with tools like moving averages or RSI. For example, when a Fibonacci level aligns with a 50-day moving average or a divergence on RSI, it strengthens the trade setup. Combine Fibonacci levels with trend lines to spot possible bounce points, or watch for price action signals like candlestick reversals at these levels. This layered approach improves entry and exit timing, making your day trading charts more reliable.
What are the advantages of using custom indicator combinations?
Custom indicator combinations help identify unique trading signals tailored to your strategy, improving accuracy. They reduce false signals by confirming trends across multiple metrics. Combining indicators like RSI and moving averages can reveal entry and exit points more clearly. They allow you to adapt to changing market conditions, giving you a competitive edge. Overall, custom combos make your charts more personalized, helping you trade with greater confidence.
How do I backtest technical indicator setups effectively?
Use historical data to simulate your indicator setups, checking how they would have performed in past market conditions. Identify clear entry and exit signals from your indicators, then analyze their success rate and drawdowns. Adjust parameters and test across different timeframes to find consistent patterns. Automate the backtest with trading software or scripts if possible, ensuring your setups are robust before applying live. Focus on risk management and avoid overfitting your indicator to past data.
Conclusion about Integrating Technical Indicators into Your Day Trading Charts
Incorporating technical indicators into your day trading strategy can significantly enhance your decision-making and improve trading outcomes. By understanding the best indicators, combining them effectively, and avoiding common pitfalls, traders can identify opportunities and manage risks more efficiently. Integrate tools like moving averages, RSI, MACD, and Bollinger Bands to create a robust trading strategy. For tailored insights and expert guidance on leveraging these indicators, consider the resources offered by DayTradingBusiness.
Learn about Integrating Backtesting into Your Day Trading Routine