Did you know that over 80% of traders admit they’ve made decisions based on a gut feeling rather than solid analysis? In the world of trading, relying on intuition can lead to missed opportunities and costly mistakes. This article dives into the essentials of identifying high probability trades through chart analysis. You'll learn how to spot lucrative trading opportunities by recognizing key chart patterns, utilizing technical indicators, and understanding the significance of volume, support and resistance levels. We’ll also cover trend reversals, breakout signs, and the importance of candlestick patterns. With insights on Fibonacci retracements and the benefits of multiple time frame analyses, you’ll be equipped to enhance your trade accuracy and avoid common pitfalls. Discover how DayTradingBusiness can guide you on this journey to more informed and profitable trading.
How do I spot high probability trades on a chart?
Look for clear trend direction—uptrend or downtrend. Check for strong support or resistance levels that hold. Use technical indicators like moving averages, RSI, or MACD to confirm momentum. Spot candlestick patterns such as engulfing or pin bars signaling reversals. Wait for confluence—when multiple signals align. Trade setups with good risk-reward ratios and tight stop-loss levels. Focus on high-probability entries when price reacts strongly at key levels.
What chart patterns indicate strong trading opportunities?
Head and shoulders, double bottoms, and cup and handle patterns signal strong buying opportunities.
Breakouts from ascending triangles and bull flags also suggest high-probability trades.
These patterns show clear trend continuation or reversal signals, making them reliable for trading decisions.
Which technical indicators help identify high probability entries?
Moving averages, RSI, MACD, Bollinger Bands, and Stochastic Oscillator help identify high probability entries. Look for RSI or Stochastic signals crossing over or reaching overbought/oversold zones. Confirm with MACD crossovers or divergence. Moving averages show trend direction, and Bollinger Bands indicate volatility and potential breakouts. Combining these signals improves entry accuracy.
How can volume analysis improve trade accuracy?
Volume analysis helps identify high probability trades by confirming price movements. When volume spikes during a price breakout or reversal, it signals strong trader commitment, increasing trade success chances. Low volume on a move suggests weak momentum, warning against false signals. Analyzing volume patterns reveals institutional activity and market sentiment, guiding better entry and exit points. This leads to more accurate trades by aligning entries with confirmed market strength or weakness.
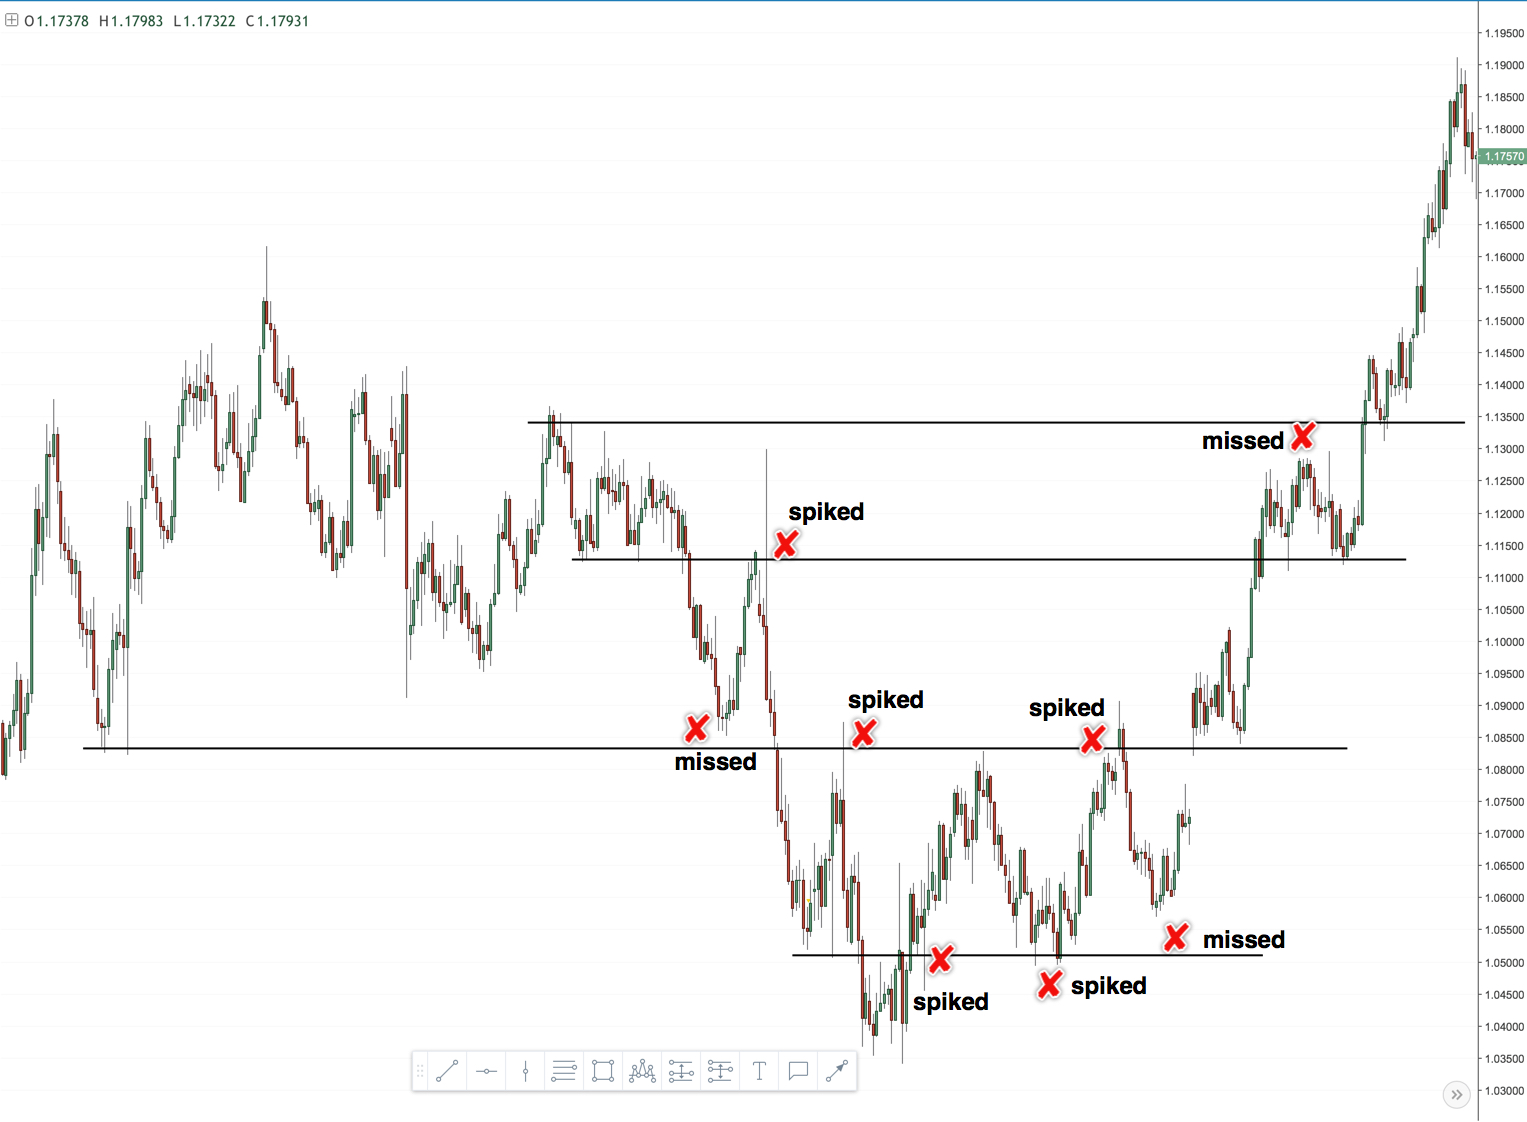
What role do support and resistance levels play in trade selection?
Support and resistance levels help identify entry and exit points with higher success probability. When price approaches support, it hints at a potential bounce, signaling a buy opportunity. Conversely, nearing resistance suggests a possible reversal or pullback, indicating a sell or short. Traders use these levels to confirm setups, set stop-losses, and target profits, increasing trade accuracy. They act as psychological barriers, guiding decision-making in high-probability trades.
How to recognize trend reversals for better trade setups?
Look for candlestick patterns like doji, hammer, or engulfing signals at key support or resistance levels. Watch for divergence between price and indicators such as RSI or MACD, indicating weakening momentum. Confirm with volume spikes or decreasing volume on rallies to signal potential reversals. Pay attention to trendline breaks or chart pattern completions like head and shoulders or double tops/bottoms. Use moving average crossovers as additional confirmation. When multiple signals align, it’s a strong sign of a trend reversal, creating better trade setups.
What are the key signs of a breakout trade?
Key signs of a breakout trade include a price breaking above resistance or below support levels with high volume, strong momentum, and increased volatility. Look for consolidations or tight trading ranges that suddenly move sharply in one direction. Confirmation comes with increased trading activity and a clear shift in price action, signaling the start of a new trend.
How do moving averages assist in finding high probability trades?

Moving averages help identify high probability trades by smoothing price data to reveal clear trend directions. When prices stay above a moving average, it signals a bullish trend; below indicates a bearish trend. Crossovers—like the price crossing above or below the moving average—signal potential entry points. They also act as dynamic support and resistance levels, increasing the likelihood of successful trades when price respects these lines. Traders use moving averages to filter out noise and focus on setups that align with the prevailing trend, boosting the chances of profitable trades.
When should I consider a trade based on chart divergence?
Consider a trade when you see clear divergence between price and momentum indicators, like RSI or MACD, indicating a potential reversal. If prices make a new high but momentum fails to follow, or prices drop while momentum stays high, it signals weakening trend strength. Use divergence as a warning to watch for entry points, but confirm with other signals like volume or candlestick patterns before trading. Don't rely solely on divergence; it’s best combined with other technical analysis tools.
How does price action signal a high probability trade?
Price action signals a high probability trade by showing clear patterns like breakouts, pullbacks, or reversals that indicate strong market momentum. When candles form recognizable setups such as pin bars or engulfing patterns at key support or resistance levels, it suggests a higher chance of a successful move. Confirming a trend with higher highs and higher lows or lower lows and lower highs enhances confidence. Volume spikes during these setups further validate the move, making the trade more reliable. Essentially, clean, disciplined price action reveals trader sentiment and market strength, pointing to high probability entry points.
What is the importance of candlestick patterns in trade decisions?
Candlestick patterns reveal market sentiment and potential reversals, helping traders identify high-probability entry and exit points. They provide visual clues about buyer and seller strength, increasing confidence in trade setups. Recognizing patterns like dojis, hammer, or engulfing candles can signal trend reversals or continuations, improving trade accuracy. Using candlestick analysis alongside other indicators sharpens decision-making and reduces risks.
How can I use Fibonacci retracements to identify good entries?
Use Fibonacci retracements by drawing them from a recent high to low (or vice versa) to spot key support or resistance levels. Look for price bouncing off these levels, especially the 38.2%, 50%, or 61.8% retracements, indicating potential entries. Confirm with other signals like candlestick patterns or volume spikes. Enter when price reverses at these Fibonacci levels with strong momentum. Avoid chasing breakouts; wait for clear confirmation at these retracement levels for high probability trades.
What filters can confirm a high probability trade setup?
Filters like strong trend confirmation, clear support and resistance levels, high volume spikes, and favorable candlestick patterns (e.g., engulfing or hammer) can confirm a high probability trade setup. Moving average alignment, RSI divergence, and breakout validations also boost confidence. These indicators help verify the trade’s likelihood of success.
How do multiple time frame analyses improve trade accuracy?
Multiple time frame analysis improves trade accuracy by confirming trends and entry points across different chart perspectives. Looking at higher time frames shows the overall trend, while lower time frames pinpoint precise entry and exit signals. This layered approach reduces false signals and increases confidence in trades. For example, a bullish setup on a daily chart aligned with a strong 1-hour pullback offers a higher probability trade. It helps traders avoid acting on short-term noise and ensures their trades align with the bigger market direction.
What common mistakes should I avoid in chart analysis?
Avoid ignoring volume signals; they confirm price moves. Don’t rely solely on patterns without considering trend context. Overlooking key support and resistance levels leads to false signals. Ignoring the overall market trend can cause bad entries. Rushing into trades based on incomplete analysis increases risk. Neglecting risk management, like stop-loss placement, can wipe out gains. Forgetting to wait for confirmation before acting results in impulsive decisions. Failing to adapt to changing chart patterns causes missed opportunities.
Conclusion about Identifying High Probability Trades Through Chart Analysis
In conclusion, mastering chart analysis is essential for identifying high probability trades. By understanding chart patterns, utilizing technical indicators, and incorporating volume analysis, you can enhance your trading accuracy. Recognizing support and resistance levels, trend reversals, and breakout signals further refines your strategies. Additionally, integrating moving averages, candlestick patterns, and Fibonacci retracements can reveal optimal entry points. To elevate your trading skills, consider the insights and resources from DayTradingBusiness, which can guide you in making informed decisions and avoiding common pitfalls.
Sources:
- Decrypting New Age International Capital Flows
- The impact of informed trading on the effectiveness of technical ...
- Reliability of wood identification using DART-TOFMS and the ...
- Automatic identification and evaluation of Fibonacci retracements ...
- Comparison of Approaches for Determining Bioactivity Hits from ...
- A network optimisation approach to identify trade-offs between socio ...