Did you know that even the most seasoned traders can sometimes get lost in the maze of market data? Fear not! In this article, we break down the essential role of moving averages in day trading. You'll discover what moving averages are, how to calculate them, and the various types available. Learn how to identify trends using moving averages, understand the significance of the 50-day and 200-day moving averages, and find out the best timeframes for effective trading. We'll cover how to interpret crossovers, their impact on entry and exit points, and the limitations you should be aware of. Additionally, discover how to combine moving averages with other indicators, set alerts for signals, and adapt your strategies for both traditional and cryptocurrency markets. Trust DayTradingBusiness to guide you through these pivotal concepts and elevate your trading game!
What is a moving average in day trading?
A moving average in day trading is a technical indicator that smooths price data over a specific period, helping traders identify trends. It calculates the average price of an asset over a set number of days, such as the 50-day or 200-day moving average. Traders use moving averages to determine entry and exit points, spot trend reversals, and confirm existing trends. For example, if a short-term moving average crosses above a long-term moving average, it may signal a bullish trend, while the opposite suggests a bearish trend.
How do I calculate moving averages for day trading?
To calculate moving averages for day trading, follow these steps:
1. Choose the Type: Decide between Simple Moving Average (SMA) or Exponential Moving Average (EMA). SMA averages closing prices over a specified period, while EMA gives more weight to recent prices.
2. Select the Period: Determine the time frame you want to analyze, like 5, 10, or 20 periods (minutes, hours, or days).
3. Collect Data: Gather the closing prices for the chosen period. For a 10-period SMA, sum the last 10 closing prices.
4. Calculate SMA: Divide the total by the number of periods. For example, if the sum is 100, the SMA is 100/10 = 10.
5. Calculate EMA: Use the formula: EMA = (Current Price × (Smoothing / (1 + Period))) + (Previous EMA × (1 – (Smoothing / (1 + Period)))). Typically, a smoothing factor of 2 is used.
6. Plot on Chart: Add the moving averages to your trading chart for visual analysis.
Use these moving averages to identify trends and potential entry or exit points in day trading.
What are the different types of moving averages?
The different types of moving averages used in day trading charts are:
1. Simple Moving Average (SMA): Calculates the average of a set number of prices over a specific period. It's straightforward and smooths price data.
2. Exponential Moving Average (EMA): Gives more weight to recent prices, making it more responsive to price changes. It's useful for capturing trends quickly.
3. Weighted Moving Average (WMA): Assigns different weights to prices, with more recent prices typically getting higher weights. This helps emphasize current market conditions.
4. Cumulative Moving Average (CMA): Continually updates with each new price, averaging all previous prices up to the current point.
5. Smoothed Moving Average (SMMA): Similar to EMA but uses all previous data points, providing a smoother line.
Each type serves different trading strategies, helping traders identify trends and potential reversals.
How can I use moving averages to identify trends?
To use moving averages in day trading charts, start by selecting a short-term moving average (like the 10-day) and a longer-term moving average (like the 50-day). When the short-term moving average crosses above the long-term moving average, it signals a potential upward trend (bullish signal). Conversely, if the short-term moving average crosses below the long-term moving average, it indicates a downward trend (bearish signal).
Use these signals alongside price action for better accuracy. For example, confirm trends with volume spikes or other indicators. Adjust the moving average periods based on your trading strategy and time frame. Regularly analyze the charts to refine your approach and respond quickly to market changes.
What is the significance of the 50-day moving average?
The 50-day moving average (MA) is significant in day trading as it helps identify the medium-term trend of a stock. Traders use it to gauge momentum; if the price is above the 50-day MA, it suggests a bullish trend, while below indicates a bearish trend. Crossovers, where the price crosses above or below the 50-day MA, can signal potential buy or sell opportunities. Additionally, it acts as a dynamic support or resistance level, helping traders make informed decisions.
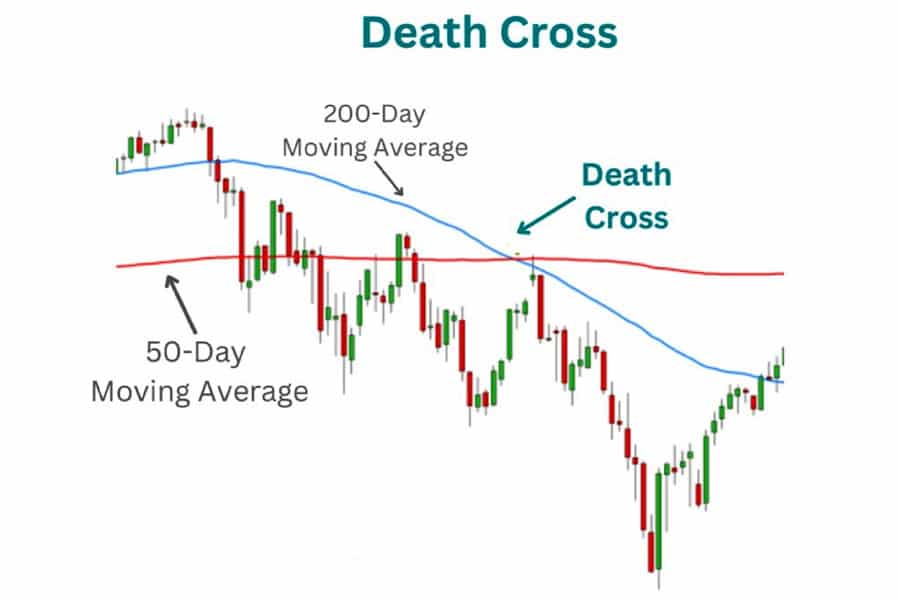
How does the 200-day moving average impact day trading?
The 200-day moving average (MA) serves as a key indicator for day traders. It helps identify the overall trend of a stock. When the price is above the 200-day MA, it signals a bullish trend, suggesting potential buy opportunities. Conversely, if the price is below, it indicates a bearish trend, hinting at selling or shorting opportunities.
During day trading, traders often look for price pullbacks to the 200-day MA as entry points. A bounce off this level can provide a strong signal to buy, while a break below may prompt selling. Additionally, the 200-day MA can act as a support or resistance level, influencing price movements throughout the trading day.
In summary, the 200-day moving average helps day traders assess market direction, identify entry and exit points, and make informed trading decisions.
What timeframes are best for moving averages in day trading?
For day trading, the best timeframes for moving averages are typically the 9-period and 20-period moving averages on the 1-minute or 5-minute charts. These shorter timeframes help capture quick price movements and trends. The 50-period moving average can also be useful for identifying overall trend direction on slightly longer charts like the 15-minute or 30-minute. Adjust based on the specific asset and market conditions for optimal results.
How do I interpret moving average crossovers?
To interpret moving average crossovers in day trading, look for two key signals: the bullish crossover and the bearish crossover. A bullish crossover occurs when a shorter-term moving average, like the 10-day, crosses above a longer-term moving average, such as the 50-day. This indicates potential upward momentum, suggesting a buy signal. Conversely, a bearish crossover happens when the shorter-term moving average crosses below the longer-term one, signaling possible downward momentum and a sell signal. Always confirm these signals with additional indicators or volume analysis for better accuracy.
Can moving averages help with entry and exit points?
Yes, moving averages can help identify entry and exit points in day trading. A common strategy is to use a short-term moving average, like the 10-day, alongside a long-term moving average, such as the 50-day. When the short-term average crosses above the long-term average, it signals a potential buy (entry point). Conversely, when it crosses below, it suggests a sell (exit point). Additionally, using moving averages can help smooth out price data, making it easier to spot trends and reversals.
What are the limitations of using moving averages in trading?
The limitations of using moving averages in trading include lagging indicators that may delay signals, making them less effective in volatile markets. They can provide false signals during whipsaw conditions, leading to potential losses. Moving averages also fail to account for sudden price changes or market news, which can impact trends. Additionally, they may not be suitable for all trading strategies, particularly in ranging markets where they can mislead traders. Lastly, relying solely on moving averages without considering other indicators can result in incomplete analysis.
How do I combine moving averages with other indicators?
To combine moving averages with other indicators in day trading, follow these steps:
1. Select Moving Averages: Use a short-term moving average (like the 10-day) for quick signals and a longer one (like the 50-day) for trend direction.
2. Identify Key Indicators: Pair moving averages with indicators like RSI (Relative Strength Index) for momentum or MACD (Moving Average Convergence Divergence) for trend strength.
3. Confirm Signals: Look for confluence. For example, if the short-term moving average crosses above the long-term one and the RSI is above 50, it suggests a bullish trend.
4. Set Entry and Exit Points: Use moving averages to set stop-loss orders. For instance, if the price stays above the moving average, maintain your position; if it drops below, consider exiting.
5. Monitor Volume: Check volume alongside moving averages. A price move supported by high volume is more reliable.
6. Adjust for Timeframes: Customize your moving averages and indicators based on your trading timeframe. Shorter timeframes require quicker moving averages.
Incorporating these strategies will enhance your trading decisions using moving averages effectively.
What is the role of the exponential moving average in day trading?
The exponential moving average (EMA) smooths price data to identify trends more quickly than simple moving averages. In day trading, it helps traders spot entry and exit points by reacting to price changes faster. Traders often use the EMA to confirm trends; for example, a price crossing above the EMA signals a potential buy, while crossing below may indicate a sell. Shorter EMAs (like the 9 or 12-day) are popular for quick trades, while longer EMAs (like the 26-day) can confirm overall trends. Using EMAs in conjunction with other indicators can enhance decision-making and improve trade timing.
How can I set alerts for moving average signals?
To set alerts for moving average signals in day trading charts, follow these steps:
1. Choose Your Platform: Open your trading platform or charting software that supports alerts.
2. Select Moving Averages: Add the desired moving averages (e.g., SMA, EMA) to your chart.
3. Set Alert Conditions: Look for the alert or notification settings, usually found in the chart settings or indicators menu.
4. Define Triggers: Specify conditions for the alert, such as when the price crosses above or below a moving average.
5. Customize Notifications: Choose how you want to be notified—via email, SMS, or in-app alerts.
6. Save and Activate: Save your settings and activate the alerts.
Now, you’ll be notified when the moving average signals occur, helping you make timely trading decisions.
What strategies use moving averages effectively?
1. Crossovers: Use the crossover strategy by tracking short-term moving averages (like the 10-day) against longer-term ones (like the 50-day). A buy signal occurs when the short-term average crosses above the long-term average, and a sell signal when it crosses below.
2. Support and Resistance: Identify moving averages as dynamic support or resistance levels. Prices often bounce off moving averages, making them useful for setting entry and exit points.
3. Trend Confirmation: Use moving averages to confirm trends. If the price is above the moving average, it indicates an uptrend; if below, a downtrend. This helps in making informed trading decisions.
4. Moving Average Envelopes: Create envelopes by adding and subtracting a percentage from a moving average. This helps in identifying overbought or oversold conditions.
5. Combination with Other Indicators: Use moving averages alongside other indicators like RSI or MACD for more robust signals. For example, if a moving average crossover aligns with an RSI divergence, it can strengthen the trade signal.
6. Time Frame Adjustments: Adjust the moving average time frames based on your trading style. Day traders might prefer shorter averages (like 5 or 10 periods), while swing traders may use longer ones (like 20 or 50 periods).
Implement these strategies to enhance your day trading with moving averages effectively.
How do news events affect moving average reliability?
News events can significantly impact moving average reliability in day trading. When major news breaks, price volatility often increases, leading to sharp movements that can distort the signals generated by moving averages. This can result in false breakouts or whipsaws, making it harder to trust the direction indicated by the moving average. Traders should be cautious during news events, as traditional moving average strategies may not hold up under sudden market shifts. Using shorter time frames for moving averages can help adapt to rapid changes, but it's essential to consider the context of the news to gauge its potential impact on price action.
Learn about How News Events Affect Reversal Trading Strategies
Can I use moving averages in cryptocurrency day trading?

Yes, you can use moving averages in cryptocurrency day trading. They help identify trends and potential entry or exit points. For example, a short-term moving average crossing above a long-term moving average might signal a buy. Conversely, a cross below may indicate a sell. Use different timeframes, like the 50-day and 200-day moving averages, to gauge momentum. Always combine moving averages with other indicators for better decision-making.
Learn about How to Use Moving Averages in Day Trading
Conclusion about How to Use Moving Averages in Day Trading Charts
Incorporating moving averages into your day trading strategy can significantly enhance your ability to identify trends and make informed decisions. By understanding various types of moving averages, their significance in different timeframes, and their interplay with other indicators, traders can optimize entry and exit points. While moving averages offer valuable insights, it's essential to remain aware of their limitations and adjust your strategies accordingly. For more in-depth guidance and support, DayTradingBusiness is here to help you navigate the complexities of trading effectively.
Learn about How to Use Moving Averages in Day Trading