Did you know that the average person spends more time choosing a cereal in the grocery store than setting up their trading workspace? Setting up an effective day trading charting workspace is crucial for successful trading. In this article, we’ll explore how to select the right charting software, essential hardware requirements, and the optimal setup for multiple monitors. We’ll also cover key indicators for day trading, customization techniques for different strategies, and the best timeframes to focus on. Learn how to organize technical analysis tools, improve clarity with color schemes, and set up alerts for price movements. Plus, we’ll share tips on managing workspace clutter, labeling charts, and optimizing performance. Finally, we’ll discuss integrating news feeds and utilizing keyboard shortcuts, ensuring your setup is both effective and secure. Dive in with DayTradingBusiness to master your day trading environment!
How do I choose the right trading charting software?
Choose charting software with real-time data, customizable layouts, and technical analysis tools. Ensure it’s user-friendly and integrates with your broker. Look for features like multiple chart types, indicators, and drawing tools. Test its speed and reliability during live trading. Pick one that fits your trading style—scalping, swing trading, or day trading—and offers easy setup for multiple monitors if needed.
What hardware do I need for an effective trading setup?
You need a reliable multi-monitor setup, a fast CPU, at least 16GB RAM, a high-resolution display (1080p or higher), a solid-state drive for quick data access, a good graphics card, a comfortable keyboard and mouse, and a stable internet connection. Consider a dual or triple monitor array for multiple charts and data streams. A backup power supply prevents disruptions. Use a quality trading computer optimized for real-time data processing.
How should I set up multiple monitors for day trading?
Arrange monitors side by side for easy viewing. Use a primary monitor for your main trading platform and secondary screens for charts, news, and watchlists. Position charts on one or two screens, keeping your order entry and execution tools on the main monitor. Adjust window sizes for clear visibility, and customize layouts to prioritize real-time data. Ensure your workspace is clutter-free, with quick access to essential tools. Use consistent color schemes and clear labels to avoid confusion during fast-paced trading.
What are the essential indicators for day trading charts?
Key indicators for day trading charts include moving averages, RSI, MACD, volume, Bollinger Bands, and stochastic oscillator.
Moving averages help identify trend direction; RSI shows overbought or oversold conditions.
MACD signals momentum shifts; volume confirms price moves.
Bollinger Bands reveal volatility, and stochastic oscillator detects potential reversals.
Use these indicators together to spot entry and exit points quickly.
How do I customize chart layouts for different trading strategies?
To customize chart layouts for different trading strategies, create multiple workspace setups with specific indicators, timeframes, and chart types. Save each layout with descriptive names like "Scalping," "Swing Trading," or "Breakout Strategy." Use layout presets to quickly switch between them based on your strategy. Adjust indicator parameters, add or remove tools, and set preferred color schemes to match your strategy’s focus. Practice switching layouts to streamline your workflow during different trading scenarios.
Which timeframes are best for day trading charts?
The best timeframes for day trading charts are 1-minute, 5-minute, and 15-minute. These provide quick, detailed price movements necessary for short-term trades while offering enough clarity to spot entry and exit points. Use 1-minute for precise entries, 5-minute for trend confirmation, and 15-minute for broader context.
How do I add and organize technical analysis tools?
Open your trading platform, then add technical analysis tools like moving averages, RSI, and MACD from the chart tools menu. Arrange them by resizing and positioning on your workspace for easy access. Use multiple chart tabs or layouts to organize different tools and timeframes. Save your setup as a template to quickly apply it for future trading sessions.
What color schemes improve clarity on trading charts?
Bright, high-contrast color schemes like dark backgrounds with light gridlines and vivid candlestick colors improve clarity on trading charts. Use contrasting colors for bullish (green or white) and bearish (red or black) candles. Avoid cluttered or overly muted palettes that make it hard to distinguish data quickly. Clear, distinct colors help identify trends and signals at a glance.
How can I set up alerts for price movements?
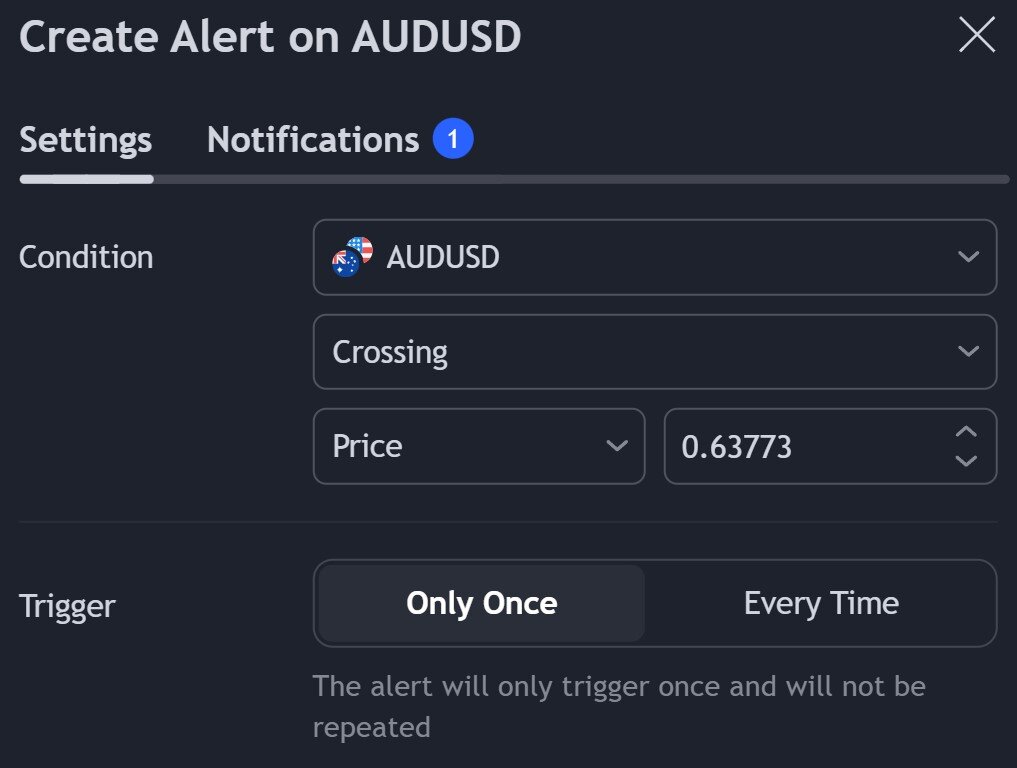
Use a trading platform like TradingView or ThinkorSwim. Set alert conditions based on price levels, percentage changes, or technical indicators. Customize alerts to trigger when a stock hits a specific price or moves a certain percentage. Enable notifications via email, pop-up, or mobile app alerts. Save your alert setup and test to ensure notifications work.
How do I manage clutter on my trading workspace?
Organize your workspace with essential tools only, remove distractions, and arrange your charts logically. Use clear labels and color coding for quick identification. Keep your trading platform clutter-free by closing unnecessary windows and tools. Regularly review and tidy your workspace to maintain focus. Use multiple monitors if possible to separate analysis from trade execution. Prioritize your most-used charts and indicators to avoid overload.
What are the best practices for labeling and annotating charts?
Label axes clearly with time and price or volume. Use descriptive titles for each chart and indicator. Mark key support and resistance levels directly on the chart. Annotate important events, like news or trade entries, with brief notes. Keep labels concise and avoid clutter. Use consistent colors for different indicators and signals. Ensure labels are legible and positioned so they don’t obscure data. Regularly review annotations to maintain clarity.
How do I optimize chart loading speed and performance?
Use lightweight charting software, limit the number of indicators, reduce data resolution, and disable unnecessary features. Keep your chart data up-to-date and avoid loading large historical data sets at once. Optimize your computer’s performance with sufficient RAM and a fast SSD. Regularly clear cache and close unused applications. Use a stable internet connection to prevent lag.
How can I incorporate news feeds into my trading workspace?

Add news feed widgets or browser extensions like MarketWatch or Bloomberg to your trading platform. Use real-time news APIs or RSS feeds integrated into your charting software. Position news alerts close to your charts for quick updates. Customize notifications for breaking news relevant to your trading assets. Keep your workspace clutter-free by filtering news sources to only show impactful headlines.
Learn about How to Incorporate Position Sizing into Your Trading Plan
What are the best keyboard shortcuts for quick chart analysis?
Use Ctrl + click to select multiple chart elements, like trendlines and indicators. Press Alt + 1 to focus on the active chart or workspace. Ctrl + D duplicates a selected chart or object quickly. Use Shift + drag to resize or move chart components precisely. Press F5 to refresh the chart data instantly. Alt + S opens the symbol search for quick symbol switching. Ctrl + Arrow keys navigate through different timeframes or zoom levels efficiently. These shortcuts streamline your setup for fast, effective day trading chart analysis.
How do I backtest trading strategies using my charts?
To backtest trading strategies using your charts, mark key entry and exit points on historical price data. Use chart tools like horizontal lines, trendlines, or annotations to simulate trades. Switch to a replay or backtesting mode if your platform has it, so you can step through past price movements. Record how your strategy performs over different timeframes and market conditions. Adjust your parameters and repeat to refine your approach.
Learn about How to Backtest Day Trading Strategies Effectively
How should I arrange my workspace for different trading assets?
Arrange your workspace by dedicating separate screens or zones for each trading asset—stocks, forex, crypto. Use multiple monitors to keep charts, order books, and news feeds visible at once. Customize each chart with specific indicators suited for that asset—like volume for stocks or RSI for forex. Keep your most-used tools within easy reach, and create a logical flow from analysis to execution. Use color coding or labels to differentiate assets quickly. Regularly tidy your workspace to avoid clutter and stay focused during trading sessions.
How do I ensure my setup is secure from technical issues?
Use a reliable internet connection, keep your trading software updated, and run antivirus scans regularly. Enable two-factor authentication on your trading accounts. Backup your chart settings and data frequently. Test your setup with demo trades before live trading. Avoid using untrusted plugins or addons. Monitor your system’s performance to catch issues early.
Conclusion about How to Set Up Your Day Trading Charting Workspace
In summary, establishing an efficient day trading charting workspace is crucial for maximizing trading performance. By selecting the right software and hardware, organizing multiple monitors, and utilizing essential indicators, traders can enhance their analysis and decision-making processes. Customizing layouts, setting alerts, and maintaining a clutter-free environment are key strategies for effective trading. Additionally, integrating news feeds and utilizing keyboard shortcuts can further streamline operations. For comprehensive guidance and support tailored to your trading journey, DayTradingBusiness is here to assist you in achieving your trading goals.
Learn about How to Combine Charting with Day Trading Strategies