Did you know that even the most seasoned traders sometimes miss support and resistance levels, leading to costly mistakes? In this article, we break down the essentials of identifying support and resistance on charts. You'll learn how to spot these crucial levels, recognize key signs, accurately draw lines, and utilize various tools for better analysis. We'll also cover the impact of timeframes, candlestick patterns, and volume on your trading decisions. Plus, discover how to avoid false breakouts and effectively use support and resistance to shape your trading strategies, including setting stop-loss and take-profit orders. For anyone looking to refine their trading skills, DayTradingBusiness provides the insights you need to navigate these critical charting concepts.
How do I spot support and resistance levels on a chart?
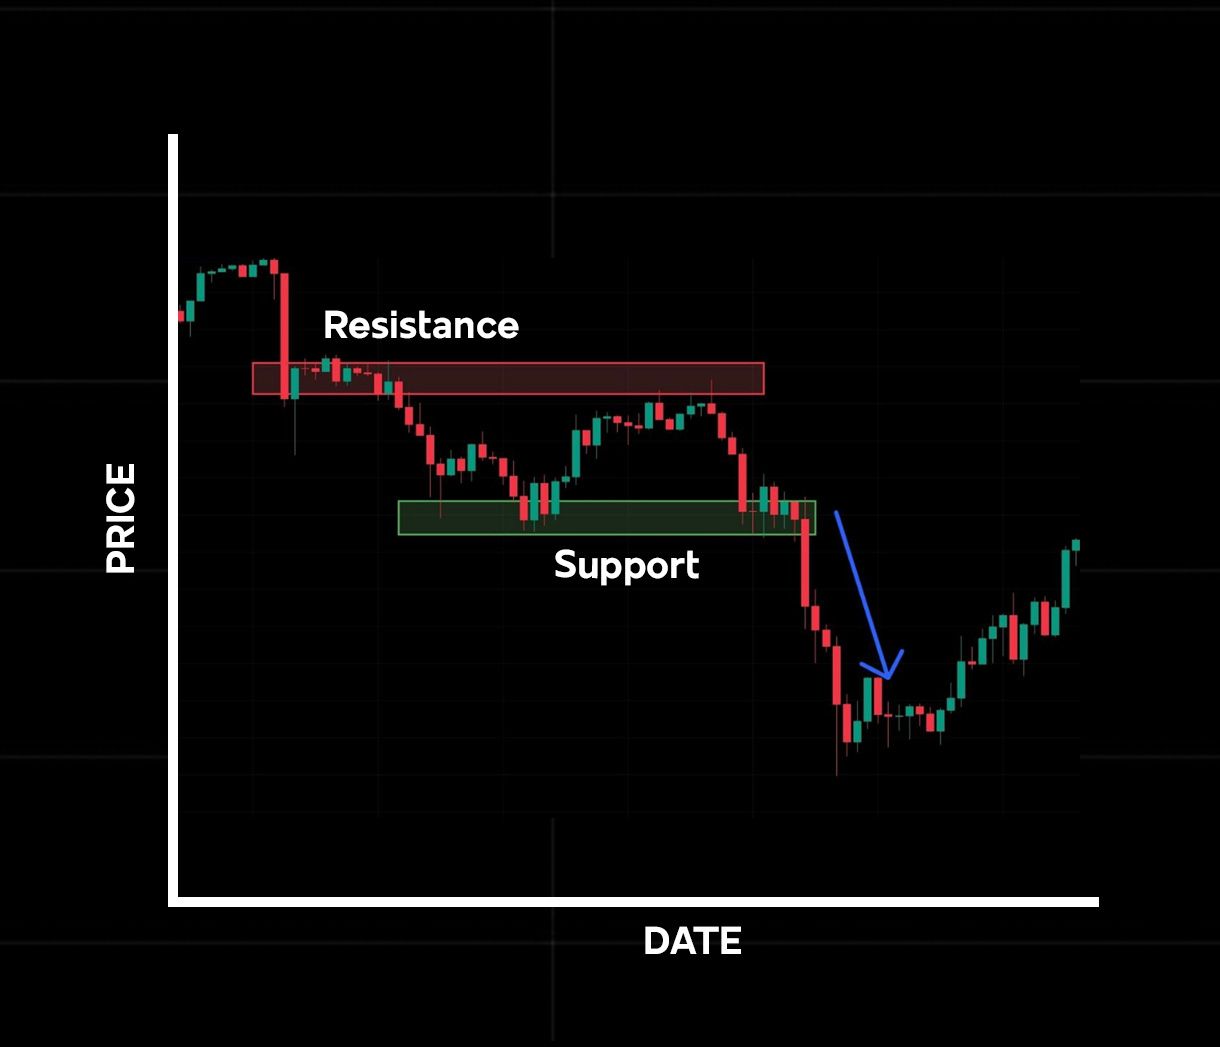
Look for price points where the chart repeatedly bounces or stalls—these are your support and resistance levels. Support shows where prices stop falling and bounce up; resistance is where they hit a ceiling and drop back. Draw horizontal lines at these points, especially if the price tests them multiple times without breaking through. Use candlestick patterns or volume spikes at these levels to confirm their strength. Trends often pause or reverse around these zones, making them key for trading decisions.
What are the key signs of support and resistance?
Key signs of support and resistance include previous price highs and lows, areas where price has repeatedly bounced or stalled, and zones with high trading volume. Support shows where buyers step in, preventing price from falling further, often marked by past lows. Resistance indicates where sellers emerge, capping upward movement, visible at previous highs. Look for horizontal lines, trendline touches, and congestion zones where price repeatedly reverses or consolidates. Volume spikes at certain levels confirm these zones as strong support or resistance.
How can I draw support and resistance lines accurately?
Identify support and resistance lines by spotting previous price lows and highs where the market reversed. Draw horizontal lines across these points, making sure they touch multiple peaks or troughs. Use candlestick wicks or closing prices for more precise levels. Confirm lines with volume spikes or price consolidations. Adjust lines as new data emerges, ensuring they reflect recent market behavior.
What tools help identify support and resistance?
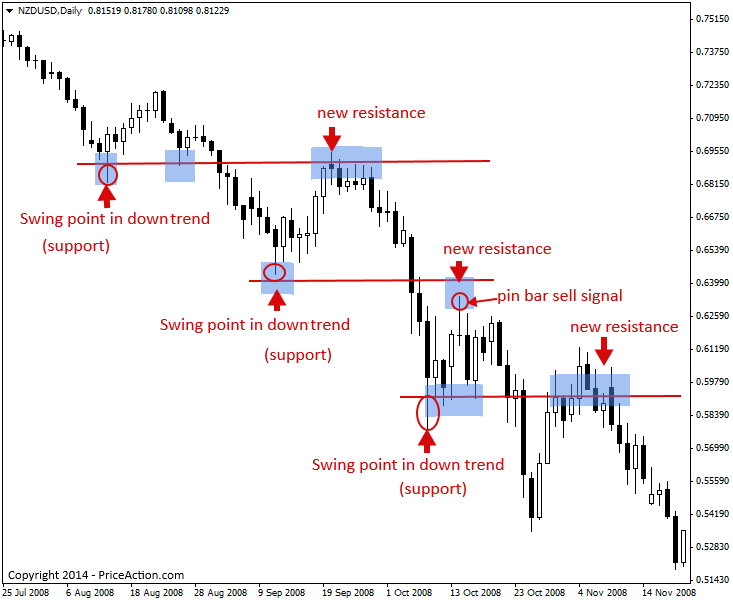
Tools like trendlines, horizontal lines, and Fibonacci retracements help identify support and resistance. Price action patterns such as swing lows and highs also reveal these levels. Moving averages can act as dynamic support or resistance. Volume analysis confirms the strength of these levels. Candlestick patterns near key areas indicate potential reversals or breakouts.
How do support and resistance levels affect price movement?

Support and resistance levels act as barriers for price movement. When price approaches support, buyers tend to step in, preventing it from falling further. Resistance levels stop upward moves as sellers enter, capping price gains. Breakouts above resistance or below support indicate potential trend shifts. Traders watch these levels for entries, exits, or confirmations of trend strength. Support and resistance shape market psychology, making them key to predicting price reactions.
Can support and resistance be different on various timeframes?
Yes, support and resistance levels vary across different timeframes. A level visible on a daily chart might not show up on a 1-hour chart, and vice versa. Longer timeframes tend to reveal stronger, more significant support and resistance, while shorter ones show more immediate, flexible levels. Traders use multiple timeframes to confirm key support and resistance zones.
How do I confirm support and resistance levels?
Check previous price points where the market reversed or stalled. Look for horizontal lines where prices repeatedly bounce or pull back. Use candlestick patterns or volume spikes at these levels as confirmation. Draw lines connecting highs and lows that the price respects multiple times. Confirm with technical indicators like moving averages or Fibonacci retracements aligning with these levels.
What role do candlestick patterns play in identifying support and resistance?
Candlestick patterns help identify support and resistance by revealing market sentiment at specific price levels. Reversal patterns like hammer or shooting star indicate potential support or resistance zones. Continuous patterns such as doji or spinning tops show indecision, hinting at possible support or resistance breaks. Combining candlestick signals with trendlines or previous highs and lows sharpens support and resistance identification.
How do breakouts relate to support and resistance?
Breakouts happen when price moves through support or resistance levels. When price breaks above resistance, it signals a potential uptrend; breaking below support suggests a downtrend. These breakouts confirm that the previous support or resistance has been overcome, indicating a shift in market sentiment. Spotting breakouts helps traders identify new trending opportunities or potential reversals.
What is the difference between static and dynamic support and resistance?
Static support and resistance are fixed levels drawn from past price points, like previous peaks or troughs, that stay constant over time. Dynamic support and resistance change with price movement, often identified using trendlines or moving averages that adjust as the chart updates. Static levels are horizontal lines; dynamic levels slope or shift with the trend. Static is based on historical price points, while dynamic adapts to ongoing price action.
How does volume help confirm support and resistance?
Volume confirms support and resistance by showing strong trader interest. When price hits a support or resistance level with high volume, it signals a potential reversal or breakout. Low volume at these levels suggests weak conviction, making the level less reliable. For example, a price bouncing off support on high volume indicates buyers are committed, reinforcing the support. Conversely, a breakout above resistance on high volume suggests strong buying pressure, confirming the level's validity.
How can trendlines indicate support and resistance?
Trendlines show support when they connect lows, indicating where prices bounce up. Resistance appears when they connect highs, showing where prices struggle to break through. When prices approach a trendline and reverse, it signals support or resistance. Breaks through a trendline suggest a potential trend change. These lines help traders spot key levels where buying or selling pressure exists.
What are false breakouts and how to avoid them?
False breakouts happen when price moves beyond support or resistance levels but then quickly reverses, trapping traders. To avoid them, wait for confirmation—like a candle close beyond the level or a retest of the breakout point before acting. Use volume spikes to validate the move, and watch for quick reversals or lack of follow-through. Avoid jumping in on a single candle or small move; patience prevents false signals.
How do support and resistance levels influence trading strategies?
Support and resistance levels guide entry and exit points in trading. When price approaches support, traders often buy, expecting a bounce. Near resistance, they may sell or short, anticipating a reversal. These levels help set stop-losses just below support or above resistance to manage risk. Breakouts above resistance or below support signal potential trend shifts, prompting traders to act accordingly. Identifying these levels sharpens decision-making and improves timing in trading strategies.
Learn about How Do Institutional Traders Influence Day Trading Strategies?
How can I use support and resistance to set stop-loss and take-profit?
Use support and resistance levels to place stop-loss just below support in an uptrend or above resistance in a downtrend. Set take-profit targets near the next resistance for longs or the next support for shorts. When price approaches support, consider exiting or tightening stops; near resistance, prepare to take profits or tighten stops. These levels act as barriers, helping you manage risk and lock in gains.
Conclusion about How to Identify Support and Resistance on Charts
In conclusion, mastering the identification of support and resistance levels is crucial for effective trading. By recognizing key signs, utilizing the right tools, and understanding their impact on price movement across various timeframes, traders can enhance their strategies significantly. Furthermore, integrating candlestick patterns and volume analysis into your approach will help confirm these critical levels. For more in-depth insights and guidance on navigating support and resistance in your trading journey, DayTradingBusiness is here to support you every step of the way.