Did you know that even the most seasoned traders sometimes mistake a candlestick for a fancy candle? In the fast-paced world of day trading, understanding how to effectively combine charting techniques with trading strategies is crucial. This article dives deep into essential chart types, the art of reading candlestick patterns, and the best technical indicators to enhance your trading decisions. You’ll learn how to identify entry points, recognize common chart patterns, and understand the influence of volume and price action. Additionally, we’ll explore the importance of setting stop-loss and take-profit levels, the role of trend analysis, and how to spot breakout signals. We also address the risks of relying solely on charts and the impact of news on trading signals. By the end, you'll be equipped with practical insights from DayTradingBusiness to elevate your day trading game.
What are the best chart types for day trading?
The best chart types for day trading are candlestick charts, line charts, and bar charts. Candlestick charts reveal market sentiment and price action clearly, making them ideal for quick decisions. Line charts are simple and help identify trends at a glance. Bar charts provide detailed info on opening, closing, high, and low prices, useful for precise entries and exits. Use candlestick charts for detailed pattern recognition, while line and bar charts support trend and support/resistance analysis.
How do I read candlestick charts for day trading?
Identify the candlestick patterns like dojis, hammers, and engulfing candles to gauge market sentiment. Look for trend directions by analyzing the body sizes—long bodies mean strong momentum, while small bodies suggest indecision. Use support and resistance levels to spot potential entry and exit points. Confirm signals with volume and other indicators like moving averages. Recognize reversals or continuations by observing pattern formations within the context of the overall trend.
Which technical indicators should I use for day trading?
Use moving averages, RSI, MACD, Bollinger Bands, and volume indicators. Combine these with price action and support/resistance levels for effective day trading.
How can I identify entry points using charts?
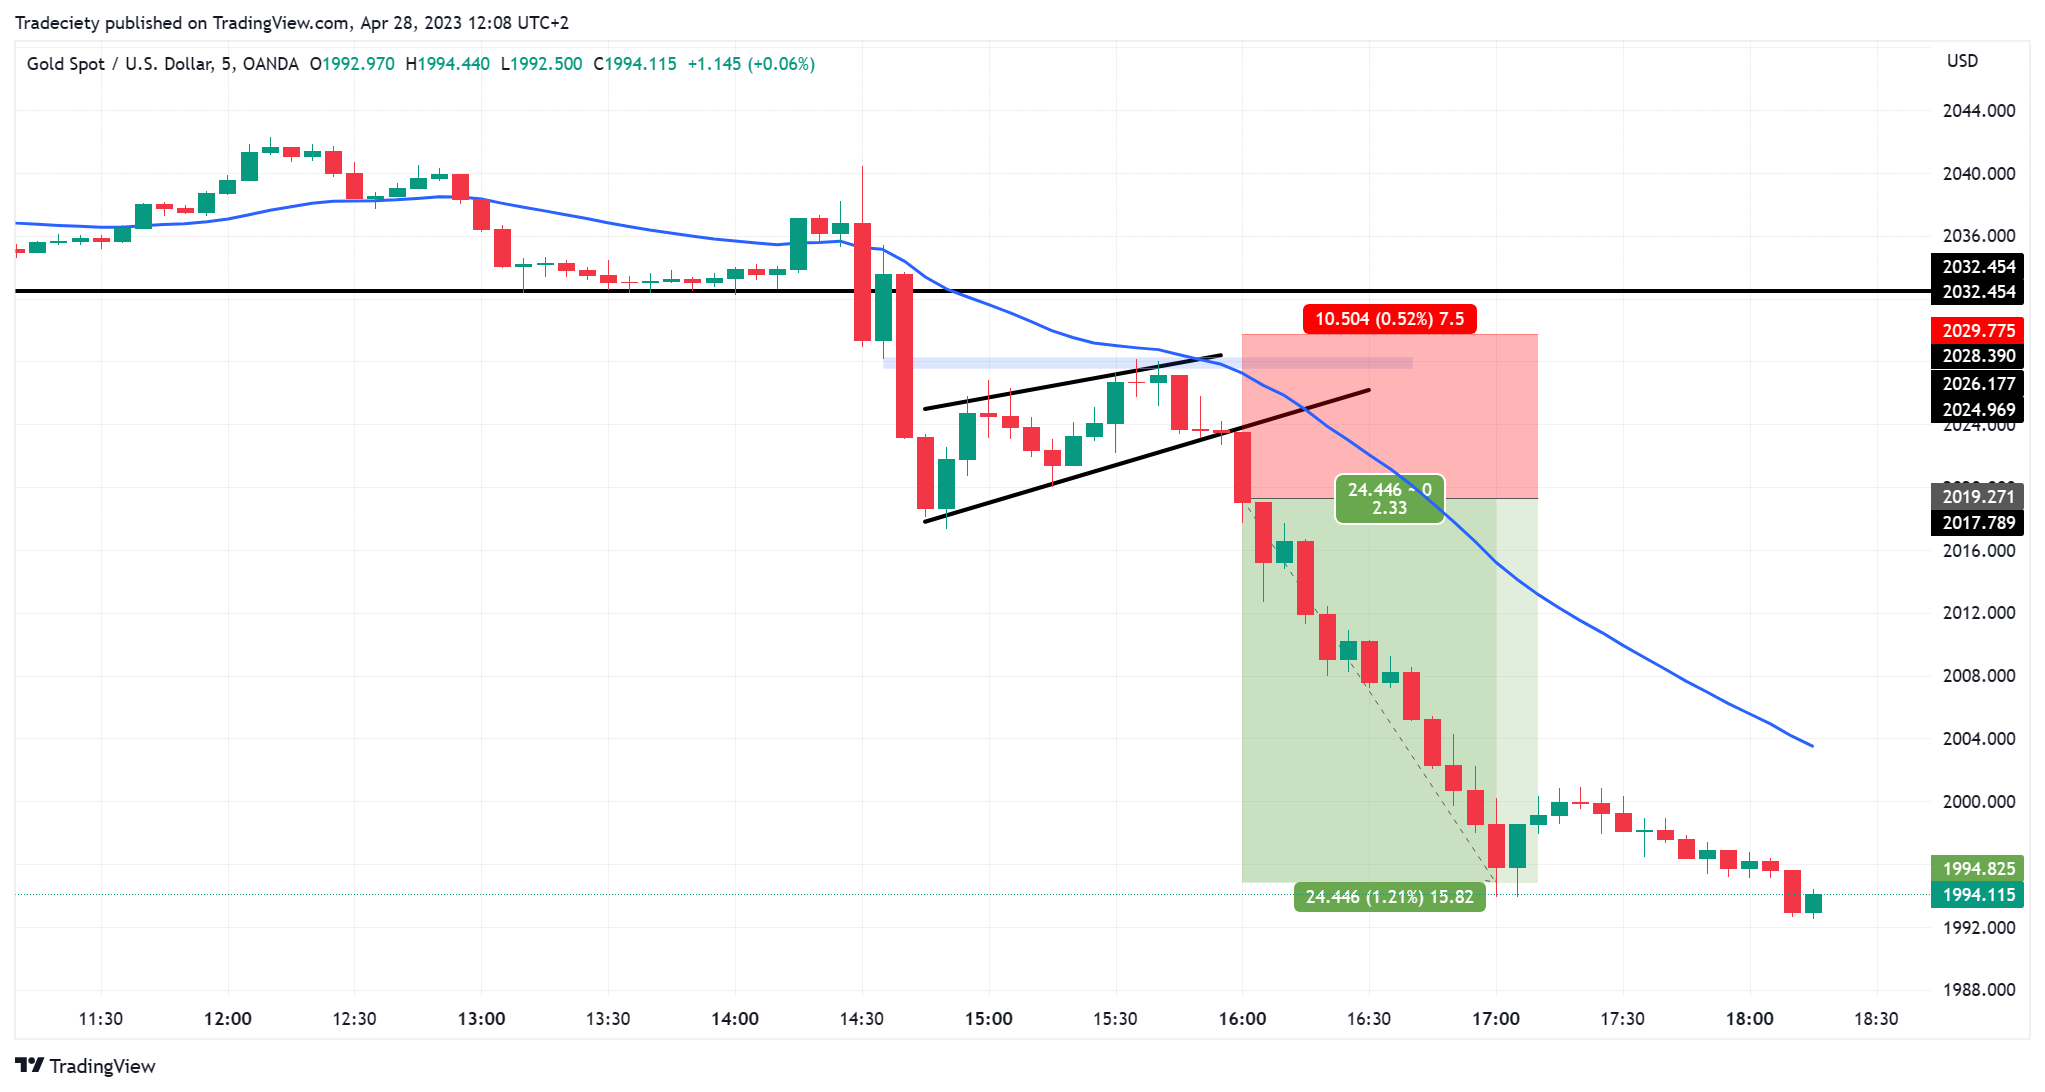
Look for support and resistance levels on your charts, where price repeatedly bounces or stalls. Watch for chart patterns like breakouts, flags, or double bottoms that signal potential entry points. Use volume spikes to confirm the strength of a move. Identify trend lines and moving averages crossing, indicating bullish or bearish entries. Candlestick patterns like doji, hammer, or engulfing can also pinpoint good entry zones. Combining these signals helps you spot precise entry points aligned with your day trading strategy.
What are common chart patterns in day trading?
Common chart patterns in day trading include head and shoulders, double tops and bottoms, flags, pennants, triangles, and wedges. These patterns signal potential reversals or continuations, helping traders time entries and exits. Recognizing these patterns on intraday charts improves decision-making and aligns with day trading strategies focused on quick moves.
How do volume and price action influence day trading decisions?
Volume confirms the strength of price moves, helping traders decide whether to enter or exit trades. High volume during an upward price move signals strong buying interest, making a breakout more reliable. Conversely, low volume suggests a lack of conviction, warning against risking on that move. Price action reveals market sentiment—sharp rallies or drops indicate momentum, guiding entry points. Combining volume spikes with clear price patterns, like breakouts or reversals, sharpens day trading decisions, making moves more confident and timely.
When should I set stop-loss and take-profit levels based on charts?
Set stop-loss and take-profit levels right after analyzing key support and resistance levels on your charts. Use recent price swings, trendlines, or chart patterns to determine where the market might reverse or stall. Place stop-loss just beyond these levels to limit losses, and set take-profit near targets indicated by previous highs or lows. Adjust these levels as the chart develops to stay aligned with current price action.
How can I combine moving averages with chart patterns?
Use moving averages to confirm chart patterns. For example, if a head and shoulders pattern forms, check if the price crosses below a 50-day moving average for a bearish signal. When a double bottom appears, watch for the price to break above a moving average for a bullish move. Align moving average support or resistance with pattern breakouts to increase confidence. Use a shorter-term moving average (like 10 or 20) to spot entry points within the pattern, and a longer-term (50 or 200) to confirm trend direction. Combining moving averages with chart patterns helps filter false signals and pinpoints optimal entry and exit points in day trading.
What role does trend analysis play in day trading?
Trend analysis helps day traders identify the market direction, spot potential entry and exit points, and confirm trading signals. It allows quick adaptation to price movements by recognizing whether an asset is trending upward, downward, or sideways. Using trend analysis alongside charting tools improves decision-making, reduces risks, and increases the chances of profitable trades in real-time market conditions.
How to spot breakout and breakdown signals on charts?
Look for breakouts when price surges above resistance with high volume, signaling a potential upward move. Spot breakdowns when price drops below support levels with increased volume, indicating a possible downward trend. Confirm signals with strong volume spikes, tight consolidation before the move, and momentum indicators like RSI or MACD turning in the direction of the breakout or breakdown. Watch for false signals—wait for price confirmation with a close beyond the level. Use candlestick patterns and chart patterns like triangles or flags to identify these points.
How do timeframes affect day trading chart analysis?
Timeframes determine the detail and perspective in day trading chart analysis. Short-term charts like 1-minute or 5-minute reveal quick price moves and entry points. Longer charts, such as 15-minute or hourly, show broader trends and support resistance levels. Combining multiple timeframes helps identify precise entry and exit points while understanding overall market direction. Using fast timeframes alone can lead to noise, while relying only on longer ones might miss quick opportunities. Properly syncing different timeframes improves decision accuracy and reduces false signals.
Learn about How Does Insider Trading Affect Day Traders?
What are the risks of relying solely on charts?
Relying solely on charts can lead to missing fundamental factors like news or earnings, causing false signals. It may cause overconfidence in technical patterns that don’t account for market volatility or sudden news events. Charts can also be misleading in choppy markets, resulting in poor entry or exit points. Without other analysis, you risk trading based on patterns that might not hold in real-time.
How can I use RSI and MACD together for better entries?
Use RSI to spot overbought or oversold conditions—below 30 suggests a buy, above 70 a sell. Check MACD for crossovers: a bullish crossover (MACD line crosses above signal line) confirms buy signals, while a bearish crossover confirms sell signals. For better entries, wait for RSI to show divergence from price action and for MACD to signal momentum shift. Enter when RSI indicates an oversold condition, and MACD confirms with a bullish crossover, ensuring stronger entry points. Conversely, for exits, look for RSI overbought and MACD bearish crossovers. Combining both helps filter false signals and improves timing in day trading.
What are the pitfalls of chart overanalysis in day trading?
Overanalyzing charts in day trading leads to paralysis by analysis, causing missed opportunities and delayed decisions. It can create confusion, making traders doubt their instincts and second-guess trades. Excessive focus on tiny details may lead to overtrading, increasing costs and risking burnout. It diverts attention from real-time market movements, reducing responsiveness. Ultimately, it hampers quick decision-making, which is crucial in fast-paced day trading.
How does news impact chart signals in day trading?
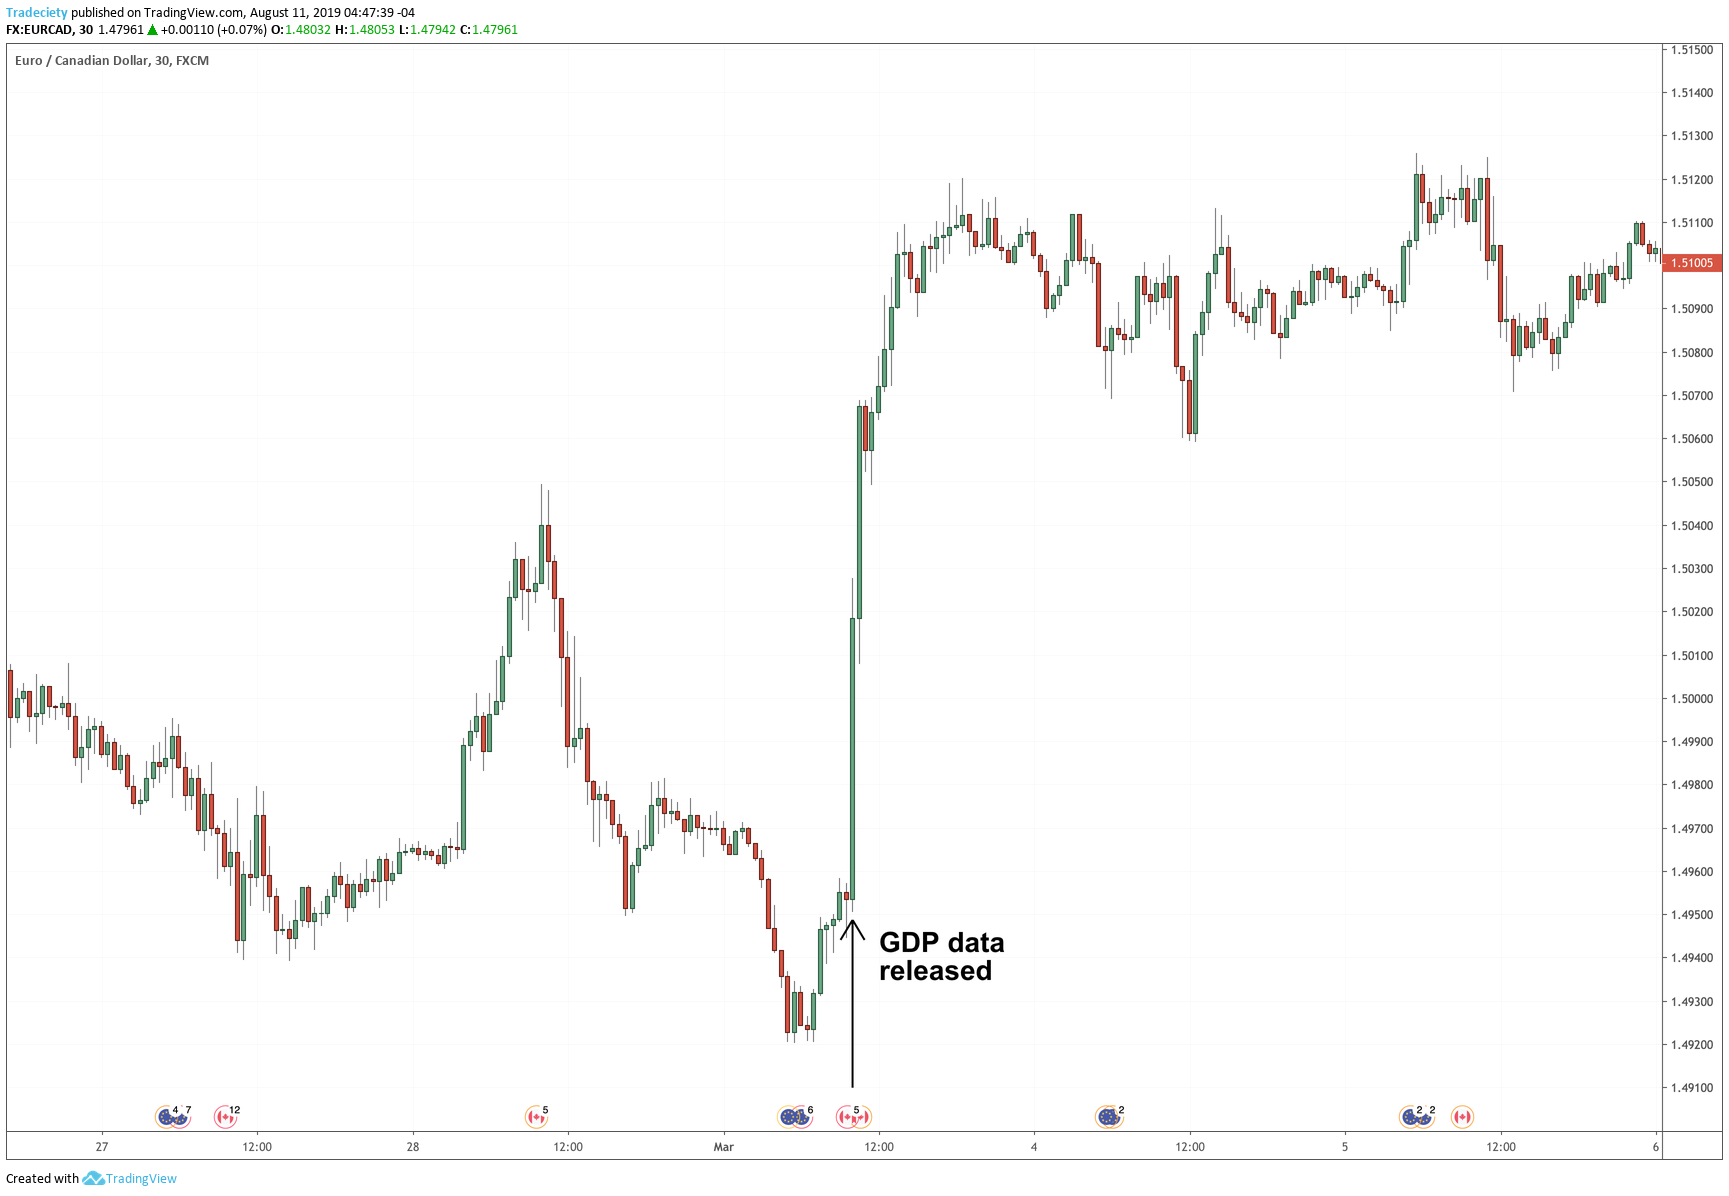
News causes sudden price jumps or drops, triggering chart signals like breakouts or reversals. It can invalidate or reinforce technical patterns, prompting traders to act quickly. Incorporating news awareness helps confirm chart signals, making trades more reliable. Ignoring news risks false signals or unexpected volatility, leading to losses. Combining chart patterns with real-time news analysis sharpens entry and exit decisions in day trading.
Learn about How Do SEC Rules Impact Day Trading?
Conclusion about How to Combine Charting with Day Trading Strategies
Incorporating effective charting techniques into your day trading strategies is essential for making informed decisions. By understanding the best chart types, mastering candlestick patterns, and utilizing key technical indicators like RSI and MACD, you can enhance your entry and exit strategies. Recognizing volume trends, setting appropriate stop-loss levels, and analyzing market news are vital for managing risks. Remember, while charts provide valuable insights, relying solely on them can lead to pitfalls. For comprehensive guidance on merging charting with day trading, DayTradingBusiness offers in-depth resources to support your trading journey.
Learn about How to Combine Technical Analysis with Day Trading Strategies