Did you know that the average trader spends more time analyzing charts than a chef spends perfecting a soufflé? Understanding how to analyze historical day trading data is crucial for making informed decisions. This article dives into effective methods for starting your analysis, from identifying patterns and key indicators to interpreting volume data and recognizing common chart formations. You'll learn how moving averages and candlestick formations can enhance your insights, as well as how to spot support and resistance levels. We'll also cover the importance of backtesting strategies, the impact of seasonal factors, and common mistakes to avoid. Join us at DayTradingBusiness for a comprehensive guide that empowers you to leverage historical charts for successful trading.
What is the best way to start analyzing historical day trading data?
Start by collecting clean, detailed daily trading charts with high and low prices, volume, and timestamps. Identify key patterns like support and resistance levels, trendlines, and chart formations. Use technical indicators like moving averages, RSI, and MACD to spot momentum and potential reversals. Look for recurring setups in different market conditions. Compare historical charts to current data to recognize repeated behaviors. Focus on significant price movements and volume spikes to understand market sentiment.
How can I identify patterns in day trading charts?
Look for recurring shapes like head and shoulders or double tops and bottoms. Notice consistent trends—uptrends, downtrends, or sideways movements. Use technical indicators such as moving averages, RSI, or MACD to spot repeated signals. Track volume spikes that often follow or precede pattern formations. Compare past chart setups to current ones to see if similar conditions reoccur. Recognize support and resistance levels that often hold or break during pattern formations.
Which indicators are most useful for analyzing past trading data?
The most useful indicators for analyzing past trading data are moving averages, RSI, MACD, volume, and Bollinger Bands. Moving averages show trend direction; RSI reveals overbought or oversold conditions; MACD indicates momentum shifts; volume confirms price moves; Bollinger Bands highlight volatility. Use these to identify patterns, entry and exit points, and trend strength in day trading charts.
How do I interpret volume data in historical charts?
Look at volume spikes to identify strong buying or selling interest. Rising volume during price increases confirms an uptrend; during declines, it signals potential downward momentum. Low volume suggests weak moves or consolidation. Compare volume levels to past data to spot unusual activity or trend shifts. Use volume to confirm chart patterns like breakouts or reversals.
What are common chart patterns in day trading analysis?
Common chart patterns in day trading analysis include head and shoulders, double tops and bottoms, flags, pennants, triangles, and cup and handle. These patterns signal potential trend reversals or continuations, helping traders make quick decisions. Recognizing them involves observing price formations, volume changes, and breakout points on candlestick or bar charts.
How can I spot support and resistance levels historically?
Look for price points where the market repeatedly reverses or stalls on past charts. Support levels are where prices bounce up after falling, while resistance levels are where prices drop after rising. Identify these by drawing horizontal lines at peaks and troughs that occur multiple times. Notice patterns like double tops or bottoms, indicating key support or resistance. Check volume at these points—higher volume often confirms their strength. Use past price action to predict where future reversals might happen.
How do moving averages help in analyzing past trades?
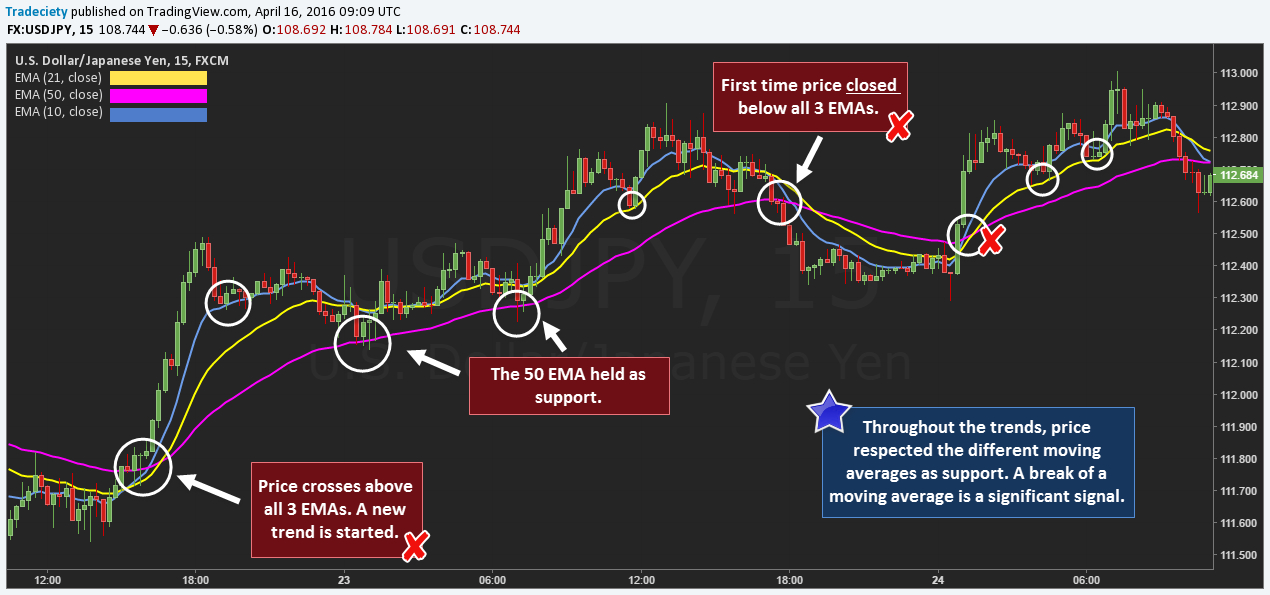
Moving averages smooth out price data to reveal trends in past trades. They help identify support and resistance levels, showing where prices have historically bounced or stalled. By comparing short-term and long-term averages, you can spot trend reversals or continuations. They also highlight momentum shifts, making it easier to evaluate the effectiveness of previous trades. Overall, moving averages provide a clear visual of past market behavior, aiding in better decision-making.
What role do candlestick formations play in historical data analysis?
Candlestick formations reveal market sentiment and trend reversals in historical data analysis. They help identify patterns like doji, hammer, or engulfing candles that signal potential entry or exit points in day trading charts. Recognizing these formations allows traders to interpret past price behaviors and predict future moves more accurately. They serve as visual clues for understanding how price action has historically reacted, guiding strategic decisions in day trading.
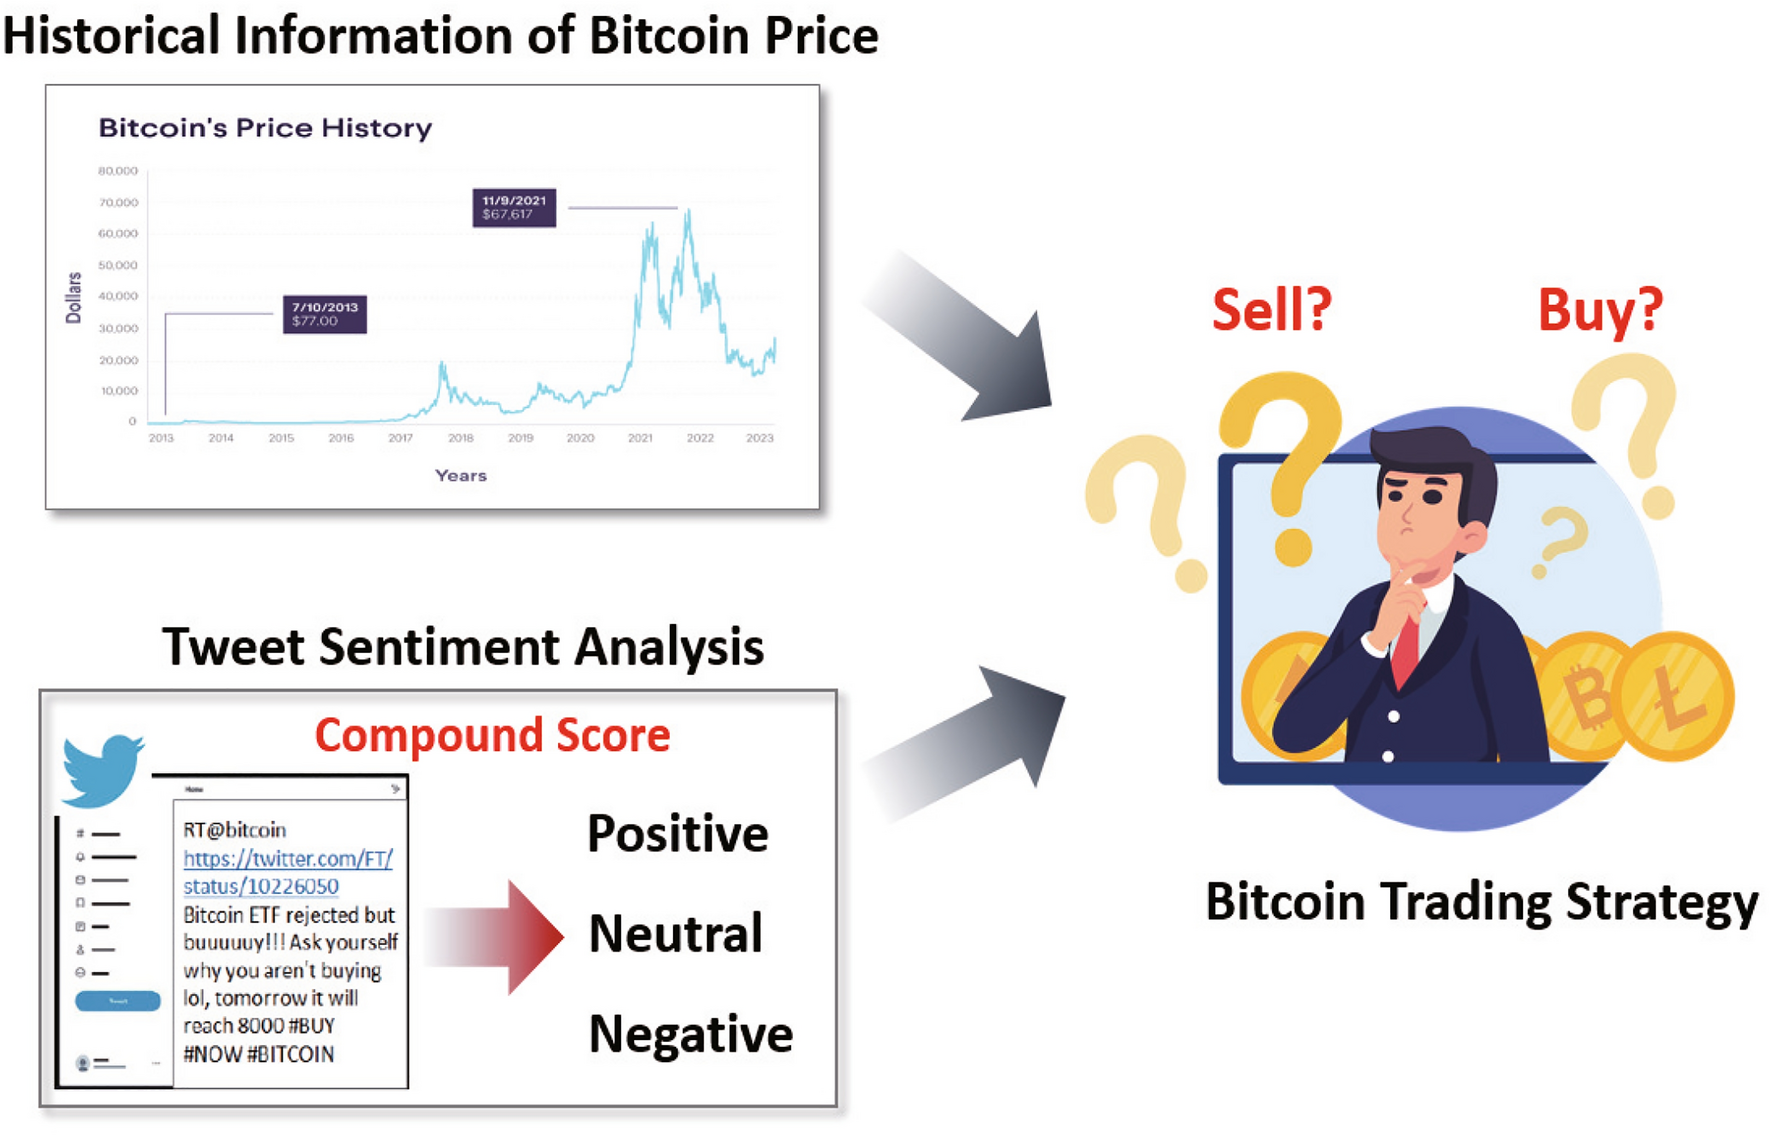
How can I use historical charts to predict future price movements?
Use historical charts to identify patterns like head and shoulders, double tops/bottoms, or trendlines. Look for recurring setups or price behaviors that preceded moves in the past. Apply technical indicators such as moving averages, RSI, or MACD on historical data to spot signals that previously indicated reversals or continuations. Recognize support and resistance levels from past charts to anticipate where prices might stall or reverse. Combine these insights with volume analysis to confirm the strength of historical patterns. Use this historical context to inform your day trading decisions, but remember it’s not foolproof.
What are the limitations of analyzing historical day trading data?
Limitations include data accuracy issues, incomplete records, and survivorship bias. Past performance doesn’t predict future results, and market conditions change. Historical charts can lack details like order types or trader psychology, making analysis less precise. Data may also be skewed by outliers or anomalous events that don’t repeat. Additionally, limited historical data can lead to overfitting strategies that don’t work in real-time trading.
How do seasonal or time-based factors influence historical charts?
Seasonal and time-based factors can cause recurring patterns in historical charts, like increased volatility during holidays or specific months. For example, stocks often dip in August or rally in December, reflecting investor behavior tied to seasons. These patterns help day traders anticipate potential market moves based on time of year or specific days. Recognizing such trends allows for better timing of entries and exits, reducing risk and improving decision-making.
How can I combine multiple indicators for better analysis?
Combine multiple indicators by layering them on your day trading charts—use moving averages for trend direction, RSI for momentum, and MACD for entry signals. Look for confluence—when multiple indicators signal the same move—to confirm trades. Adjust indicator settings to suit your trading style and timeframe. Avoid overloading your chart; focus on key indicators that complement each other. Use them together to identify entry and exit points more reliably, like a moving average crossing confirmed by RSI divergence.
What mistakes should I avoid when analyzing past trading data?
Avoid cherry-picking data that supports your bias and ignoring contradictory info. Don't rely solely on past performance without considering market changes or news that affected those trades. Use too-short timeframes, which can give misleading signals. Ignore transaction costs, taxes, and slippage—they impact real profit. Overfitting your analysis to past data without testing on new data leads to false confidence. Neglecting volume and market context can cause misinterpretation of signals. Finally, avoid emotional bias—stick to your data-driven strategy and don’t chase past winners or ignore losses.
How do I backtest my trading strategies using historical charts?
Open your trading platform’s charting tool, select the time frame matching your strategy, and load historical data. Mark entry and exit points based on your rules, then simulate trades by manually applying your strategy to past price movements. Review the results to see profit, loss, and win rate, adjusting your approach as needed. Use backtesting software if available for automated, detailed analysis.
Learn about How to Backtest Day Trading Strategies Effectively
How often should I review historical data for effective day trading?
Review historical data daily or weekly to identify patterns and trends that inform your day trading decisions. Focus on recent data for immediate market context and occasional longer-term reviews to spot bigger trends. Consistent analysis helps you adapt quickly and refine your trading strategy.
Learn about How to Use Historical Data in Day Trading Analysis
Conclusion about How to Analyze Historical Data Using Day Trading Charts
In summary, effectively analyzing historical data using day trading charts is crucial for making informed trading decisions. By identifying patterns, utilizing key indicators, and understanding volume data, traders can enhance their strategies and predict future price movements. It's essential to recognize the limitations of historical analysis and avoid common pitfalls to maximize success. Regularly reviewing and backtesting strategies will further refine your approach. For comprehensive insights and support in navigating the complexities of trading, consider the resources offered by DayTradingBusiness.
Learn about Using Historical Data for Day Trading Pattern Analysis