Did you know that the stock market has more ups and downs than a roller coaster? Understanding the twists and turns of day trading can be a thrilling ride, and mastering essential chart indicators is key to navigating it successfully. This article dives into the most crucial indicators, including moving averages, the Relative Strength Index (RSI), and Bollinger Bands, to enhance your trading strategies. We'll explore the significance of volume indicators, MACD, candlestick patterns, and Fibonacci retracement levels, along with trend lines and support/resistance levels that guide decision-making. Plus, discover how the Average True Range (ATR) and stochastic oscillators can optimize your trades. Lastly, we address common pitfalls and the benefits of combining multiple indicators for improved results. With insights from DayTradingBusiness, you'll be equipped to make informed trading decisions.
What are the most essential chart indicators for day trading?
The most essential chart indicators for day trading are:
1. Moving Averages (MA): Use the 50-day and 200-day MAs to identify trends and potential reversals.
2. Relative Strength Index (RSI): This momentum oscillator helps identify overbought or oversold conditions, guiding entry and exit points.
3. Moving Average Convergence Divergence (MACD): This indicator shows the relationship between two moving averages, useful for spotting trend reversals.
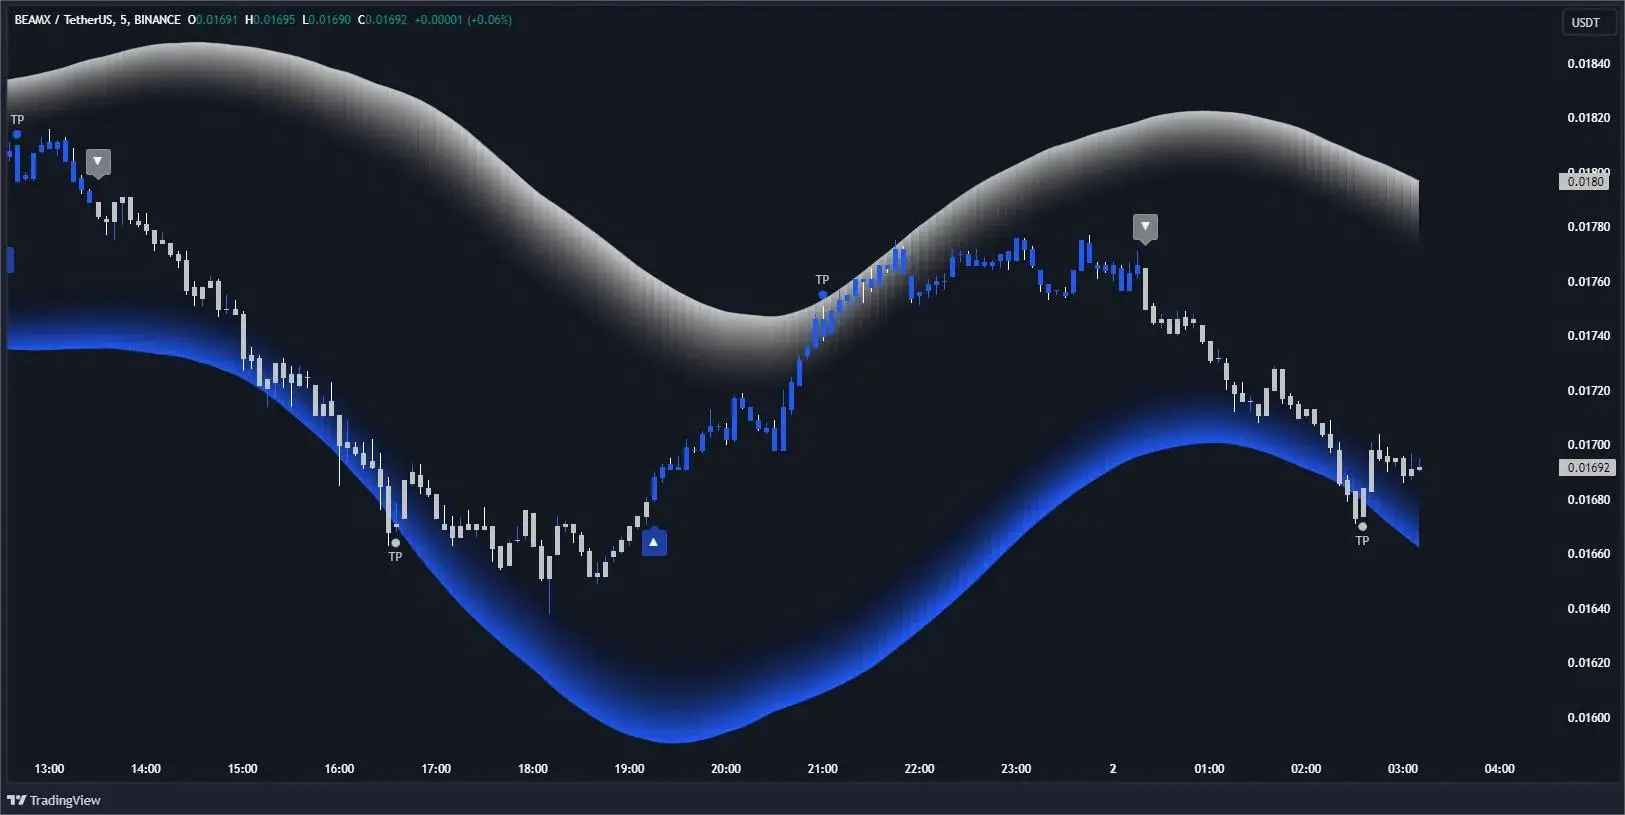
4. Bollinger Bands: These help determine volatility and potential price breakouts or reversals.
5. Volume: Analyze trading volume to confirm trends; high volume typically indicates strong price movement.
6. Stochastic Oscillator: This helps identify potential reversal points by comparing a security's closing price to its price range over a specific period.
Use these indicators to enhance your day trading strategy and make informed decisions.
How do moving averages help in day trading?
Moving averages help in day trading by smoothing price data to identify trends, support, and resistance levels. Traders use short-term moving averages, like the 5 or 10-day, to spot quick price shifts, while longer-term averages, such as the 50 or 200-day, help confirm trend direction. Crossovers, where a short-term moving average crosses above or below a long-term average, signal potential buy or sell opportunities. Additionally, moving averages can help filter out market noise, making it easier to focus on significant price movements.
What is the significance of the Relative Strength Index (RSI) in trading?
The Relative Strength Index (RSI) is significant in trading as it helps identify overbought or oversold conditions in a market. It ranges from 0 to 100, with levels above 70 indicating overbought conditions and below 30 indicating oversold conditions. Traders use RSI to spot potential reversal points, confirming entry and exit signals. It enhances decision-making by providing insights into price momentum and trend strength, making it a crucial tool for day trading success.
How can Bollinger Bands improve day trading strategies?
Bollinger Bands can enhance day trading strategies by providing clear signals for price volatility and trend direction. When the bands tighten, it indicates low volatility, often leading to a breakout. Traders can look for price touching the upper band to signal overbought conditions and the lower band for oversold conditions. This helps in making informed entry and exit decisions. Additionally, the middle band acts as a dynamic support or resistance level, guiding traders on potential reversals. Using Bollinger Bands in combination with other indicators can further refine trading strategies and increase success rates.
What role do volume indicators play in day trading?
Volume indicators are crucial in day trading as they provide insight into market activity and strength. They help traders confirm price movements; for example, rising prices with high volume suggest strong buying interest, while falling prices with high volume indicate strong selling pressure. Volume can also signal potential reversals; low volume during a price change may suggest a lack of conviction. Additionally, volume indicators can identify breakouts; a surge in volume during a breakout signals that the move is more likely to sustain. Overall, they enhance decision-making by revealing the underlying momentum behind price trends.
How do MACD indicators work for day traders?
MACD indicators, or Moving Average Convergence Divergence, help day traders identify momentum and potential reversals. It consists of two lines: the MACD line and the signal line. When the MACD line crosses above the signal line, it signals a bullish trend; when it crosses below, it indicates a bearish trend.
Traders often look for divergences between the MACD and price to spot potential reversals. For day trading, using shorter time frames like 5-minute or 15-minute charts can provide quick signals for entry and exit points. Combining MACD with other indicators, like RSI or moving averages, enhances its effectiveness.
What is the importance of candlestick patterns in day trading?
Candlestick patterns are crucial in day trading because they provide visual cues about market sentiment and potential price movements. These patterns help traders identify trends, reversals, and continuations, allowing for informed entry and exit points. Recognizing formations like dojis, hammers, and engulfing patterns can enhance decision-making and risk management, ultimately improving trading outcomes. Understanding these patterns increases a trader's ability to read the market effectively, making them essential tools for success.
How can Fibonacci retracement levels assist day traders?
Fibonacci retracement levels help day traders identify potential reversal points in price movements. By marking key levels—23.6%, 38.2%, 50%, 61.8%, and 76.4%—traders can spot where prices might bounce or pull back during a trend. When a stock retraces to these levels, it often indicates a good entry or exit point. Additionally, combining Fibonacci levels with other indicators, like moving averages or volume, enhances trading decisions. Ultimately, they provide a structured approach to gauge market sentiment and manage risk effectively.
What are the best chart patterns to recognize for day trading?
The best chart patterns for day trading include:
1. Head and Shoulders: Indicates a reversal in trend.
2. Double Top/Bottom: Signals potential reversals; double top for bearish, double bottom for bullish.
3. Triangles (Ascending, Descending, Symmetrical): Indicate continuation or reversal depending on breakout direction.
4. Flags and Pennants: Short-term continuation patterns after a strong price movement.
5. Cup and Handle: Suggests bullish continuation; the cup forms a rounded bottom, and the handle shows a slight pullback.
Recognizing these patterns can help you make informed trading decisions.
How do trend lines guide day trading decisions?
Trend lines guide day trading decisions by identifying the direction of price movement. Traders draw trend lines on charts to spot support and resistance levels, helping them determine entry and exit points. When the price approaches a trend line, it can signal potential reversals or continuations. A break above a resistance trend line may indicate a buying opportunity, while a break below a support trend line can suggest selling. By analyzing these lines, traders can make informed decisions that align with market momentum.
Learn about How to Use Trend Lines in Day Trading Charts
What is the impact of support and resistance levels on day trading?
Support and resistance levels are crucial for day trading as they indicate price points where stocks tend to reverse or stall. Traders use these levels to identify entry and exit points. When the price approaches support, it may bounce back up, offering a buying opportunity. Conversely, near resistance, the price often drops, signaling a potential sell. Understanding these levels helps traders manage risk and set stop-loss orders effectively. They also enhance decision-making by providing clear targets, increasing the likelihood of successful trades.
Learn about Identifying Support and Resistance Levels in Day Trading
How can the Average True Range (ATR) be used in day trading?
The Average True Range (ATR) can help day traders measure market volatility and set precise stop-loss orders. Use ATR to determine position sizing; a higher ATR suggests wider stops due to increased volatility, while a lower ATR allows for tighter stops. Traders often look for price movements that exceed a multiple of the ATR, indicating strong momentum. Additionally, monitoring ATR trends can signal potential breakouts or reversals, guiding entry and exit decisions. Tracking ATR alongside price action enhances risk management and improves trade timing.
What are the advantages of using stochastic oscillators in trading?
Stochastic oscillators help traders identify overbought or oversold conditions, providing clear entry and exit signals. They enhance trend analysis by indicating potential reversals, allowing for timely trades. This indicator is also useful for confirming price movements, reducing the risk of false signals. By combining stochastic readings with other indicators, traders can refine their strategies, improving overall decision-making.
How do Ichimoku clouds function in day trading?
Ichimoku clouds function in day trading by providing a comprehensive view of support and resistance levels, trend direction, and momentum. The cloud itself consists of five lines: Tenkan-sen, Kijun-sen, Senkou Span A, Senkou Span B, and Chikou Span.
Traders look for buy signals when the price is above the cloud and the Tenkan-sen crosses above the Kijun-sen. Conversely, sell signals occur when the price is below the cloud and the Tenkan-sen crosses below the Kijun-sen. The thickness of the cloud indicates the strength of support or resistance; a thicker cloud suggests stronger levels.
Day traders often use these signals to time entries and exits, enhancing their strategy for quick trades based on clear visual indicators.
What are the common pitfalls of relying on chart indicators for trading?
Common pitfalls of relying on chart indicators for trading include over-reliance on signals, which can lead to missed opportunities when market conditions change. Many traders ignore fundamental analysis, focusing solely on indicators, resulting in poor decision-making. Lagging indicators can provide delayed signals, causing entries and exits at suboptimal times. Additionally, using too many indicators can create confusion and lead to analysis paralysis. Finally, failing to adapt indicators to different market conditions can result in losses, as indicators may work well in trending markets but fail during consolidations.
How can day traders combine multiple indicators for better results?
Day traders can enhance their results by combining indicators like moving averages, RSI, and MACD. Use moving averages to identify trends, then apply the RSI to gauge overbought or oversold conditions. Incorporate the MACD for momentum confirmation. For instance, if a stock is trending up (moving average), appears overbought (RSI), but the MACD shows strong momentum, it might signal a continuation rather than a reversal. This layered approach helps make more informed trading decisions.
Conclusion about Essential Chart Indicators for Day Trading Success
Incorporating essential chart indicators is vital for achieving success in day trading. Understanding tools like moving averages, RSI, and Bollinger Bands can enhance your strategy significantly. Additionally, recognizing patterns, support and resistance levels, and using volume indicators can provide deeper insights into market movements. While combining multiple indicators may yield better results, it’s crucial to avoid common pitfalls associated with over-reliance on these tools. For comprehensive guidance and insights into optimizing your trading strategies, DayTradingBusiness is here to support your journey in the markets.
Learn about Essential Indicators for Day Trading Success