Did you know that some traders spend more time customizing their charting tools than they do on actual trades? In this article, we delve into the essential charting tools that can significantly enhance your day trading success. Discover the best charting tools available, explore their key features, and learn how they can amplify your trading strategies. We'll cover the effectiveness of free tools, the importance of technical indicators and chart patterns, and how to select the right software for your needs. Plus, we'll discuss mobile options, integration with news feeds, and common pitfalls to avoid. With insights from DayTradingBusiness, you're equipped to make informed decisions that can lead to better market trend analysis and overall trading performance.
What are the best charting tools for day trading?
The best charting tools for day trading include:
1. TradingView – Offers advanced charting features, custom indicators, and social networking.
2. Thinkorswim by TD Ameritrade – Provides extensive technical analysis tools and real-time data.
3. MetaTrader 4/5 – Popular for forex trading, with customizable charts and automated trading options.
4. NinjaTrader – Ideal for futures and forex, featuring advanced charting and simulation capabilities.
5. StockCharts – Great for stock analysis with user-friendly charts and a variety of indicators.
These tools enhance day trading by providing real-time data, technical analysis, and customization options.
How do charting tools enhance day trading strategies?
Charting tools enhance day trading strategies by providing real-time data visualization, allowing traders to identify trends, patterns, and price movements quickly. They enable the use of technical indicators like moving averages, RSI, and MACD, which help in making informed decisions. Customizable charts let traders focus on specific time frames, optimizing their entry and exit points. Additionally, charting tools often include features like alerts and backtesting capabilities, further refining trading strategies and improving overall success.
What features should I look for in a day trading charting tool?
Look for real-time data updates, customizable indicators, and a user-friendly interface in a day trading charting tool. Ensure it offers various chart types (like candlestick and line charts), advanced technical analysis features, and comprehensive drawing tools. Access to historical data, backtesting capabilities, and integration with brokerage accounts are also crucial. Lastly, check for mobile compatibility for trading on the go.
Are free charting tools effective for day trading?
Yes, free charting tools can be effective for day trading. They often provide essential features like real-time data, customizable charts, and technical indicators. While they may lack advanced functionalities found in premium tools, many traders successfully use free options for analysis and decision-making. Popular free tools include TradingView and ThinkorSwim. Ultimately, effectiveness depends on how well you leverage the available features to inform your trading strategy.
How can I use technical indicators in charting tools?
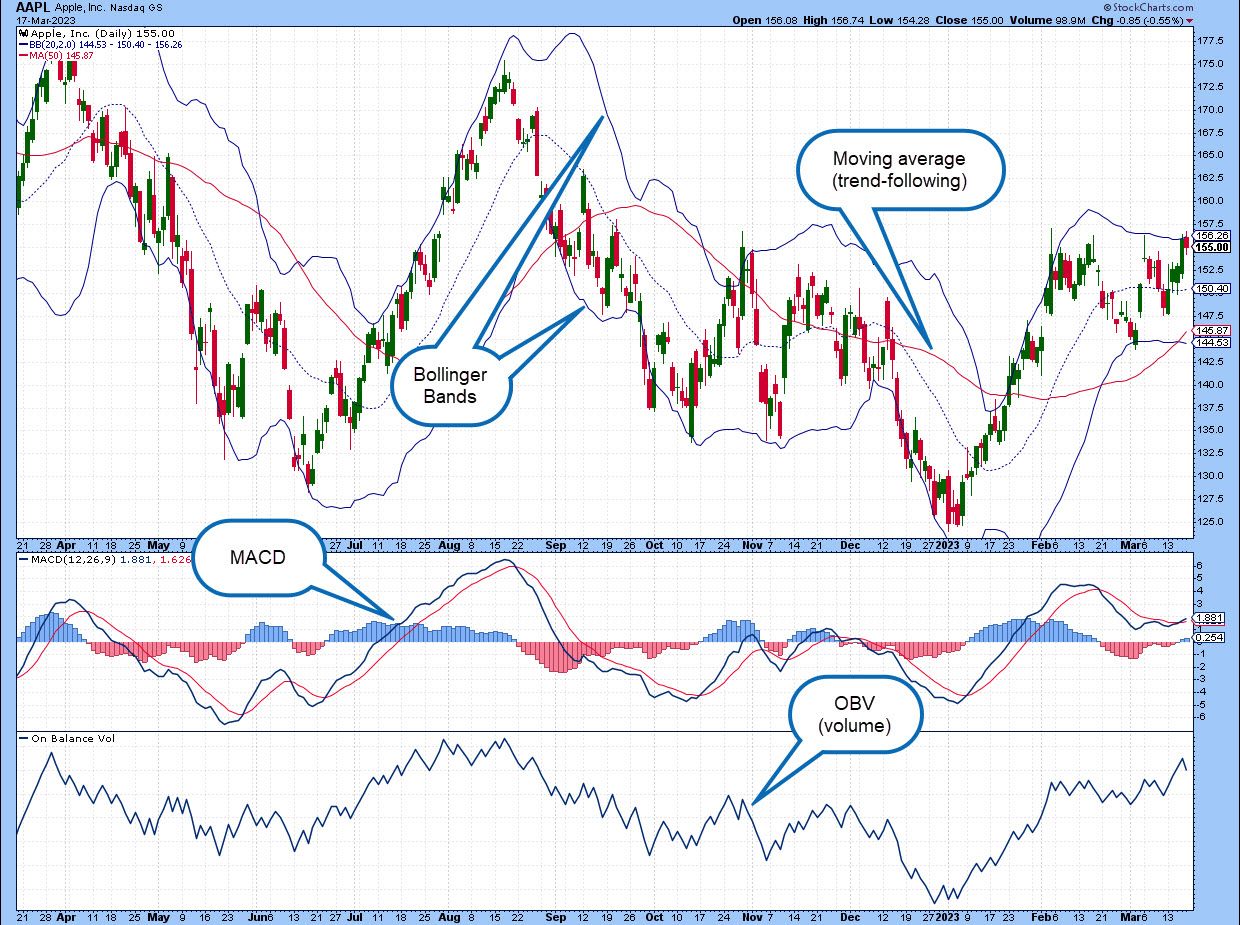
To use technical indicators in charting tools for day trading, start by selecting a charting platform that offers various indicators. Common indicators include moving averages, RSI, MACD, and Bollinger Bands. Apply these indicators to your charts to analyze price trends and market momentum.
1. Choose Indicators: Pick indicators that suit your trading strategy. For example, use moving averages for trend direction and RSI for overbought/oversold conditions.
2. Customize Settings: Adjust the settings of each indicator based on your trading style. Shorter timeframes may require different parameters than longer ones.
3. Combine Indicators: Use multiple indicators together for confirmation. For instance, if a moving average crossover aligns with an RSI signal, it could strengthen your trade decision.
4. Analyze Signals: Look for buy or sell signals generated by the indicators. For example, a bullish signal occurs when the price crosses above a moving average.
5. Backtest Strategies: Use historical data to test how your indicators would have performed in past trades to refine your approach.
6. Monitor Real-Time Charts: Continuously observe your indicators during trading hours for timely decision-making.
By integrating technical indicators into your charting tools, you can enhance your analysis and improve your day trading success.
What is the role of chart patterns in day trading?
Chart patterns play a crucial role in day trading by helping traders identify potential price movements and trends. Patterns like flags, triangles, and head and shoulders signal entry and exit points. Recognizing these formations can improve decision-making and enhance risk management. Additionally, chart patterns often reflect market psychology, providing insights into trader sentiment. Using them effectively can lead to more informed trades and increased profitability.
How do I choose the right charting software for day trading?
Choose charting software for day trading by considering these key factors:
1. User Interface: Look for an intuitive, easy-to-navigate interface that suits your style.
2. Real-Time Data: Ensure it provides real-time market data and fast execution speeds.
3. Chart Types: Check if it supports various chart types (candlestick, line, etc.) and customization options.
4. Technical Indicators: Look for a wide range of built-in indicators and drawing tools for analysis.
5. Backtesting Features: Consider software that allows backtesting strategies to refine your approach.
6. Integration: Ensure it integrates with your broker for seamless trading.
7. Mobile Access: If you trade on the go, mobile compatibility is crucial.
8. Cost: Evaluate pricing plans, including any hidden fees for data feeds or premium features.
Test a few platforms with free trials to find the one that fits your trading style best.
Can charting tools help with market trend analysis?
Yes, charting tools are essential for market trend analysis in day trading. They provide visual representations of price movements, helping traders identify patterns and trends quickly. Features like indicators and overlays enhance decision-making by offering insights into market momentum, volatility, and potential reversal points. Using charting tools effectively can significantly improve trading strategies and increase success rates.
What are the top paid charting tools for day traders?
The top paid charting tools for day traders include:
1. TradeStation – Offers advanced charting capabilities and custom indicators.
2. MetaStock – Known for powerful technical analysis and extensive historical data.
3. NinjaTrader – Provides advanced charting, backtesting, and trading strategy development.
4. Thinkorswim by TD Ameritrade – Features robust charting tools and a wide range of technical indicators.
5. TradingView Pro – Offers real-time data, social networking features, and customizable charts.
These tools enhance day trading success with real-time analytics and customizable features.
How do mobile charting apps compare for day trading?
Mobile charting apps for day trading vary in features like real-time data, technical indicators, and user interface. Apps like TradeStation and Thinkorswim offer advanced charting tools and customization, making them ideal for experienced traders. In contrast, simpler apps like Robinhood provide basic charts and are user-friendly for beginners. Speed and reliability of data feed are crucial; apps with slower updates can hinder trading decisions. Additionally, integration with brokerage accounts enhances functionality. Ultimately, the best app depends on your trading style and experience level.
What charting tools are best for forex day trading?
The best charting tools for forex day trading include:
1. TradingView: Offers advanced charting capabilities, social networking features, and a wide range of indicators.
2. MetaTrader 4/5: Popular for its user-friendly interface, customizable charts, and automated trading options.
3. NinjaTrader: Provides extensive charting options and backtesting capabilities, ideal for strategy development.
4. Thinkorswim: Known for powerful analytical tools, customizable charts, and a robust trading platform.
5. cTrader: Features intuitive charting tools, a range of technical indicators, and a user-friendly layout.
These platforms help traders analyze price movements, identify trends, and make informed trading decisions.
Learn about What Are the Best AI Tools for Day Trading?
How can I integrate news feeds with my charting tools?
To integrate news feeds with your charting tools, use APIs from news services like Bloomberg or Reuters to pull real-time data. Many charting platforms, like TradingView or ThinkorSwim, offer built-in news widgets that display relevant updates. You can also set up alerts for specific stocks or market events, ensuring you receive timely information. Consider using platforms that allow custom scripting or plugins to tailor news integration directly into your charts for a seamless trading experience.
What are the common mistakes to avoid when using charting tools?
1. Overcomplicating Charts: Avoid adding too many indicators that clutter your analysis. Stick to a few key ones.
2. Ignoring Timeframes: Don’t use inconsistent timeframes. Ensure your charts match your trading strategy’s timeframe.
3. Relying Solely on Charts: Don’t depend only on visual data. Incorporate fundamentals and news events into your analysis.
4. Neglecting Risk Management: Always set stop-loss orders. Failing to manage risk can lead to significant losses.
5. Misinterpreting Patterns: Be cautious with chart patterns. Ensure you understand their implications before acting on them.
6. Confirmation Bias: Avoid only looking for data that supports your bias. Stay objective and consider opposing signals.
7. Failing to Backtest: Don’t skip backtesting your strategies. Validate them against historical data to gauge effectiveness.
8. Ignoring Volume: Always consider trading volume alongside price movements. Low volume can lead to false signals.
9. Inconsistent Updates: Regularly update your charts. Relying on outdated information can mislead your decisions.
10. Emotional Trading: Avoid letting emotions dictate your trades. Stick to your strategy and chart analysis.
How do different chart types affect day trading decisions?
Different chart types impact day trading decisions by highlighting various aspects of price movement. Candlestick charts provide detailed information on price action, helping traders spot trends and reversals quickly. Line charts simplify the view, making it easier to identify overall price direction but lacking intraday detail. Bar charts offer a middle ground, showing open, high, low, and close prices, useful for understanding volatility.
Using volume charts helps traders gauge market strength, while tick charts focus on price changes over a set number of trades, aiding in high-frequency trading. Each chart type influences entry and exit points, risk management, and overall trading strategy, allowing traders to adapt their decisions based on the visual data presented.
Learn about How Does Insider Trading Affect Day Traders?
What is the importance of real-time data in charting tools?
Real-time data in charting tools is crucial for day trading success because it allows traders to make informed decisions based on the latest market movements. Instant access to price changes, volume, and trends helps identify opportunities and risks quickly. This immediacy enables traders to react promptly to market fluctuations, enhancing their ability to execute profitable trades. Without real-time data, traders risk making decisions based on outdated information, which can lead to significant losses. Ultimately, real-time data is essential for optimizing strategies and maximizing gains in day trading.
How can I customize my charting tools for better performance?
To customize your charting tools for better performance in day trading, follow these steps:
1. Select the Right Platform: Choose a trading platform that offers robust charting features like real-time data, multiple indicators, and customizable layouts.
2. Utilize Technical Indicators: Add indicators such as moving averages, RSI, and MACD that suit your trading style. Adjust their settings based on your strategy.
3. Set Up Alerts: Configure price alerts and notifications for key levels or indicator triggers to stay updated without constantly monitoring charts.
4. Customize Chart Types: Experiment with different chart types (candlestick, line, bar) and time frames to find what best highlights market trends for your trades.
5. Color Schemes and Layouts: Choose color schemes that reduce eye strain and layouts that prioritize the information you use most frequently.
6. Save Templates: Create and save chart templates for different strategies or stocks to streamline your setup process for future trades.
7. Use Drawing Tools: Utilize trend lines, Fibonacci retracements, and other drawing tools to visualize potential support and resistance levels.
8. Backtesting Features: If available, use backtesting features to assess the effectiveness of your indicators and strategies on historical data.
By tailoring these aspects of your charting tools, you can enhance your decision-making process and improve your day trading performance.
Conclusion about Charting Tools That Boost Day Trading Success
In conclusion, selecting the right charting tools is crucial for enhancing day trading strategies and making informed decisions. Effective charting tools, whether free or paid, should offer essential features like real-time data, customizable options, and integration with technical indicators and news feeds. By avoiding common pitfalls and understanding the various chart types and patterns, traders can better analyze market trends and improve their overall trading performance. For those seeking comprehensive guidance and resources, DayTradingBusiness is your go-to source for navigating the complexities of day trading.
Learn about Building a Day Trading Charting Routine for Success