Did you know that even the most seasoned day traders can have a win rate lower than a coin flip? In the world of day trading backtesting, understanding key metrics is crucial for developing effective strategies and mitigating risks. This article dives into essential metrics such as win rate, profit factor, risk-to-reward ratios, and drawdown assessments. Learn how to calculate average trade duration and the significance of the Sharpe ratio, while also exploring the impact of volatility, slippage, and trading commissions. Discover best practices for interpreting results and ensuring data reliability, along with tools to visualize your findings. With insights from DayTradingBusiness, you'll be equipped to enhance your backtesting approach and optimize your trading performance.
What are the essential key metrics for day trading backtesting?
The essential key metrics for day trading backtesting include:
1. Win Rate: Percentage of profitable trades.
2. Profit Factor: Ratio of gross profit to gross loss.
3. Maximum Drawdown: Largest peak-to-valley decline in account equity.
4. Average Trade Duration: Time trades are held.
5. Risk-Reward Ratio: Average profit per trade divided by average loss.
6. Sharpe Ratio: Measures risk-adjusted return.
7. Total Return: Overall percentage gain or loss over the backtest period.
Analyzing these metrics helps evaluate a trading strategy's effectiveness and risk profile.
How do you calculate the win rate in day trading backtesting?
To calculate the win rate in day trading backtesting, divide the number of winning trades by the total number of trades, then multiply by 100.
Formula:
Win Rate (%) = (Number of Winning Trades / Total Number of Trades) × 100
For example, if you had 30 winning trades out of 100 total trades, your win rate would be 30%. This metric helps assess the effectiveness of your trading strategy.
What is the significance of the profit factor in backtesting?
The profit factor in backtesting measures the ratio of gross profits to gross losses. It indicates the effectiveness of a trading strategy; a profit factor above 1 suggests a profitable system, while below 1 indicates a loss. A higher profit factor means better risk-reward, helping traders assess strategy viability and optimize trading decisions. It’s essential for evaluating how well a strategy performs in various market conditions.
How can you assess risk-to-reward ratios in backtesting?
To assess risk-to-reward ratios in backtesting, calculate your potential profit against your potential loss for each trade. First, identify your entry and exit points, then determine the stop-loss level. Use the formula: Risk-to-Reward Ratio = (Potential Profit) / (Potential Loss). A ratio of 2:1 means for every $1 risked, you aim to make $2. Analyze this across multiple trades to ensure consistency. Track these metrics over time to refine your strategy and improve decision-making. Adjust your criteria based on historical performance to enhance future trading outcomes.
What metrics help evaluate drawdown in day trading strategies?
Key metrics to evaluate drawdown in day trading strategies include:
1. Maximum Drawdown: The largest peak-to-trough decline during a specific period.
2. Average Drawdown: The average decline from peak to trough over multiple trades.
3. Recovery Time: The time taken to recover from a drawdown back to a previous peak.
4. Drawdown Duration: The length of time the account balance stays below a previous peak.
5. Calmar Ratio: The ratio of annual return to maximum drawdown, indicating return per unit of risk.
These metrics provide insights into risk management and strategy robustness in day trading.
How do you measure the average trade duration in backtesting?

To measure the average trade duration in backtesting, calculate the total time for all trades and divide it by the number of trades. Track the entry and exit timestamps for each trade, then sum the durations. For instance, if you have five trades lasting 10, 15, 20, 5, and 30 minutes, the total duration is 80 minutes. Divide 80 by 5, resulting in an average trade duration of 16 minutes.
Why is the Sharpe ratio important for day trading backtesting?
The Sharpe ratio is crucial for day trading backtesting because it measures risk-adjusted performance. It helps traders understand how much excess return they earn for each unit of risk taken. A higher Sharpe ratio indicates a more favorable risk-return profile, which is essential for evaluating strategies effectively. In day trading, where quick decisions matter, the Sharpe ratio guides traders in selecting strategies that maximize returns while minimizing risk exposure. This metric enables better comparisons between different trading strategies, ensuring that traders make informed decisions based on both returns and volatility.
What role does volatility play in backtesting metrics?
Volatility is crucial in backtesting metrics because it affects risk management and strategy performance. High volatility can lead to larger price swings, impacting profit and loss potential. It also influences trade frequency; more volatile assets may provide more entry and exit signals. Assessing volatility helps traders refine their strategies, optimizing for different market conditions and improving overall performance metrics like Sharpe ratio or maximum drawdown.
How can you analyze trading frequency in your backtest?
To analyze trading frequency in your backtest, focus on the following key metrics:
1. Number of Trades: Count the total trades executed during the backtest period.
2. Trade Duration: Measure how long positions are held on average.
3. Win Rate: Calculate the percentage of profitable trades versus total trades.
4. Profit Factor: Compare gross profits to gross losses to assess the effectiveness of your strategy.
5. Average Trade Return: Determine the average profit or loss per trade.
These metrics help evaluate whether your trading frequency aligns with your strategy goals and risk tolerance. Adjust your strategy based on these insights to optimize performance.
What is the impact of slippage on backtesting results?
Slippage negatively impacts backtesting results by skewing profit and loss outcomes. It can distort expected returns, increase losses, and misrepresent win rates. For example, if a strategy shows a 70% win rate in backtesting without accounting for slippage, actual trading could reveal a significantly lower win rate. This discrepancy can lead traders to overestimate a strategy’s effectiveness. Therefore, including realistic slippage estimates in backtesting is crucial for achieving accurate and reliable performance metrics.
How do commissions and fees affect backtesting metrics?

Commissions and fees directly reduce your net profits during backtesting, impacting key metrics like return on investment (ROI), win rate, and profit factor. Higher costs can make winning trades less profitable and losing trades more significant, skewing results. For accurate backtesting, always include realistic commission and fee structures to ensure metrics reflect potential real-world performance.
What is the difference between gross and net profit in backtesting?
Gross profit in backtesting refers to the total profits from winning trades before accounting for any costs, such as commissions or slippage. Net profit, on the other hand, is the actual profit after subtracting all expenses associated with trading, including those costs. In summary, gross profit shows raw trading success, while net profit provides a clearer picture of actual profitability after expenses.
How can you use the maximum drawdown metric effectively?
To use the maximum drawdown metric effectively in day trading backtesting, focus on these steps:
1. Set Benchmarks: Compare the maximum drawdown of your strategy against benchmarks or industry averages to gauge performance.
2. Risk Management: Use it to assess risk by determining how much capital you could potentially lose during adverse conditions.
3. Adjust Strategies: Analyze drawdown patterns to refine your trading strategy, minimizing periods of significant loss.
4. Position Sizing: Incorporate drawdown metrics into your position sizing calculations to maintain acceptable risk levels.
5. Performance Assessment: Regularly review maximum drawdown alongside other metrics like win rate and profit factor for a holistic view of your strategy’s effectiveness.
6. Psychological Preparedness: Understand the potential drawdown to mentally prepare for losses, helping you stick to your strategy during tough times.
By integrating maximum drawdown into your backtesting analysis, you can enhance risk management and improve overall trading performance.
What are the best practices for interpreting backtesting results?
To effectively interpret backtesting results in day trading, focus on these key metrics:
1. Net Profit: Assess total gains minus losses to gauge overall performance.
2. Win Rate: Calculate the percentage of profitable trades to understand consistency.
3. Risk-Reward Ratio: Evaluate potential profit against potential loss per trade.
4. Maximum Drawdown: Identify the largest peak-to-trough decline to measure risk exposure.
5. Sharpe Ratio: Analyze risk-adjusted returns; higher values indicate better risk management.
6. Trade Duration: Monitor average time held per trade to align with your strategy.
7. Number of Trades: Consider sample size; too few trades can skew results.
Focus on these metrics to gain actionable insights into your trading strategy's effectiveness.
How do you ensure your backtesting data is reliable and accurate?
To ensure your backtesting data is reliable and accurate, follow these steps:
1. Source Quality Data: Use reputable data providers that offer clean, adjusted historical data, including splits and dividends.
2. Data Integrity Checks: Regularly check for anomalies or errors in the dataset, such as missing values or outliers.
3. Use Sufficient Sample Size: Backtest over a large enough time frame and diverse market conditions to capture varied performance.
4. Account for Slippage and Commissions: Incorporate realistic transaction costs and slippage into your backtesting to reflect real trading conditions.
5. Validate Results: Compare backtest results with actual historical performance to ensure consistency.
6. Robustness Testing: Run sensitivity analyses to see how changes in parameters affect performance, ensuring your strategy is not overfitted.
7. Peer Review: Share your methodology and results with experienced traders for feedback and validation.
Implementing these practices will enhance the reliability and accuracy of your day trading backtesting data.
What tools can help visualize key metrics in day trading backtesting?

Tools that can help visualize key metrics in day trading backtesting include:
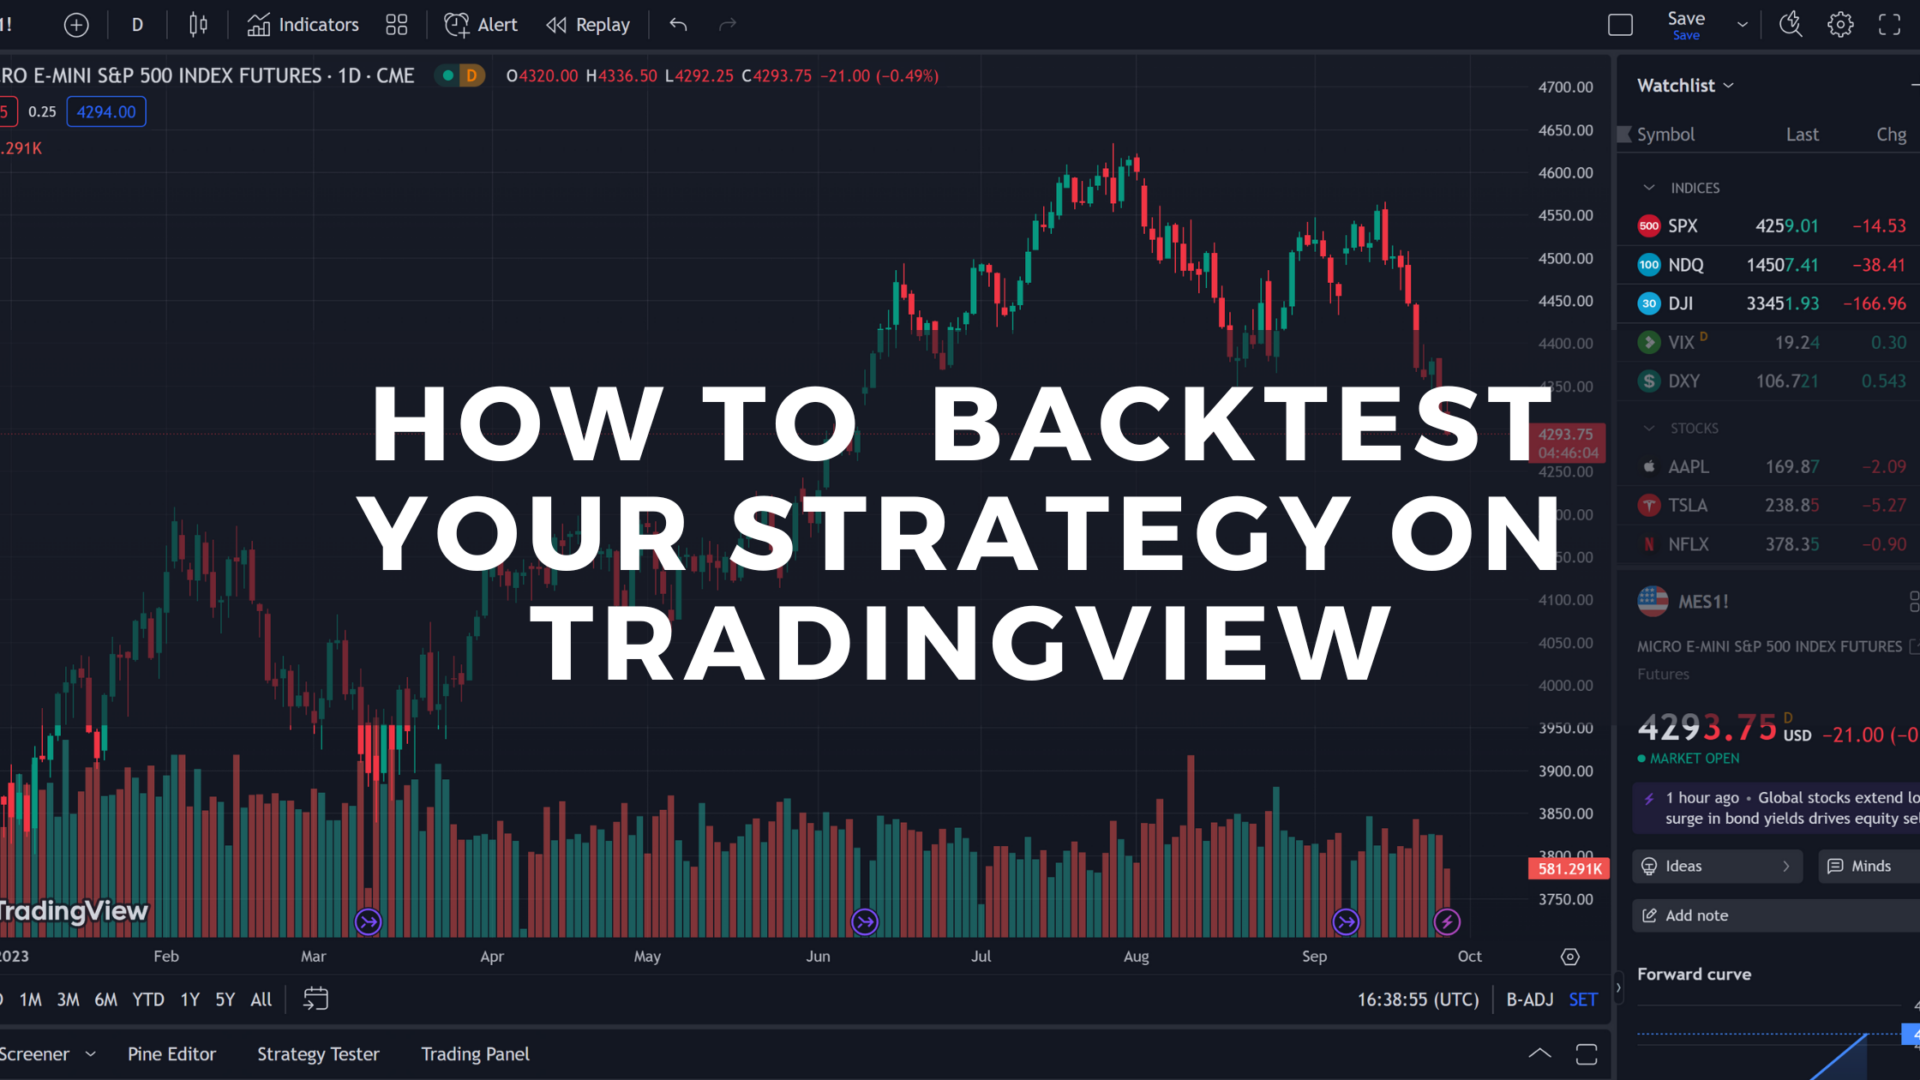
1. TradingView: Offers customizable charts and technical indicators for visualizing performance metrics.
2. MetaTrader: Provides built-in backtesting tools with detailed reports and visual performance graphs.
3. Excel: Use for creating custom charts and graphs to analyze metrics like profit factor and drawdown.
4. Python Libraries (Matplotlib, Seaborn): Great for customized data visualizations and statistical analysis.
5. Amibroker: Features advanced charting tools and performance metrics visualization for backtesting strategies.
6. QuantConnect: A cloud-based platform that allows for backtesting with visual analytics of trading performance.
These tools help traders analyze metrics like win rate, risk/reward ratio, and drawdown visually.
Learn about Key Metrics to Evaluate Day Trading Algorithms
Conclusion about Key Metrics to Analyze in Day Trading Backtesting
In conclusion, understanding key metrics in day trading backtesting is essential for developing effective trading strategies. Metrics such as win rate, profit factor, and risk-to-reward ratios provide critical insights into performance, while assessing drawdown and average trade duration helps gauge risk. Additionally, considering factors like slippage, commissions, and volatility can significantly impact your results. For traders seeking to refine their approach, leveraging reliable tools for visualization and adhering to best practices in data accuracy is paramount. By focusing on these metrics, you can enhance your trading strategies and improve overall performance with the guidance of DayTradingBusiness.
Learn about Frequently Asked Questions About Day Trading Backtesting
Sources:
- Volume Weighted Average Price (VWAP) The Holy Grail for Day ...
- Interagency Supervisory Guidance on Counterparty Credit Risk ...
- A profitable trading algorithm for cryptocurrencies using a Neural ...
- A No-Code Machine Learning System for Next Day Equity and ...
- Large Language Model Agent in Financial Trading: A Survey
- TradingAgents: Multi-Agents LLM Financial Trading Framework