Did you know that even the best day traders can get it wrong—like the time one accidentally bought a "stock" in a fictional company from a movie? Understanding backtesting results is crucial for steering clear of such blunders. This article dives into what backtesting is and how to conduct it effectively for day trading strategies. We’ll explore key metrics like win rates and maximum drawdown, and discuss the importance of risk-reward ratios. Additionally, we’ll highlight common pitfalls to avoid, the impact of sample size, and the best software tools for your analysis. Finally, we’ll address how market conditions influence results and the limitations of backtesting. With insights from DayTradingBusiness, you’ll be better equipped to interpret backtesting outcomes and refine your trading strategy.
What are backtesting results in day trading?
Backtesting results in day trading show how a trading strategy would have performed using historical data. To interpret these results, focus on key metrics:
1. Profitability: Check the total return and compare it to benchmarks.
2. Win Rate: Look at the percentage of profitable trades versus total trades.
3. Risk-Reward Ratio: Assess the average gain per winning trade against the average loss per losing trade.
4. Drawdown: Evaluate the maximum loss from a peak to a trough during the backtest.
5. Consistency: Analyze performance across different market conditions to gauge reliability.
Understanding these metrics helps to determine if a strategy is viable for real-time trading.
How do I conduct backtesting for day trading strategies?
To interpret backtesting results for day trading strategies, follow these steps:
1. Review Key Metrics: Focus on metrics like profit factor, win rate, and maximum drawdown. A higher profit factor indicates better risk-to-reward, while a win rate above 50% is generally favorable.
2. Analyze Trade Distribution: Look at the distribution of winning and losing trades. Consistency matters; a strategy with frequent small wins and few large losses is often more reliable.
3. Examine Timeframes: Check results across different timeframes. A strategy that performs well on one timeframe may not work on another.
4. Evaluate Market Conditions: Consider the market conditions during backtesting. Strategies can perform differently in trending versus ranging markets.
5. Check for Overfitting: Ensure the strategy isn’t overly tailored to past data. If results are too good to be true, the strategy may not perform well in live trading.
6. Conduct Sensitivity Analysis: Alter parameters slightly to see how robust the strategy is. If results vary significantly, it might not be reliable.
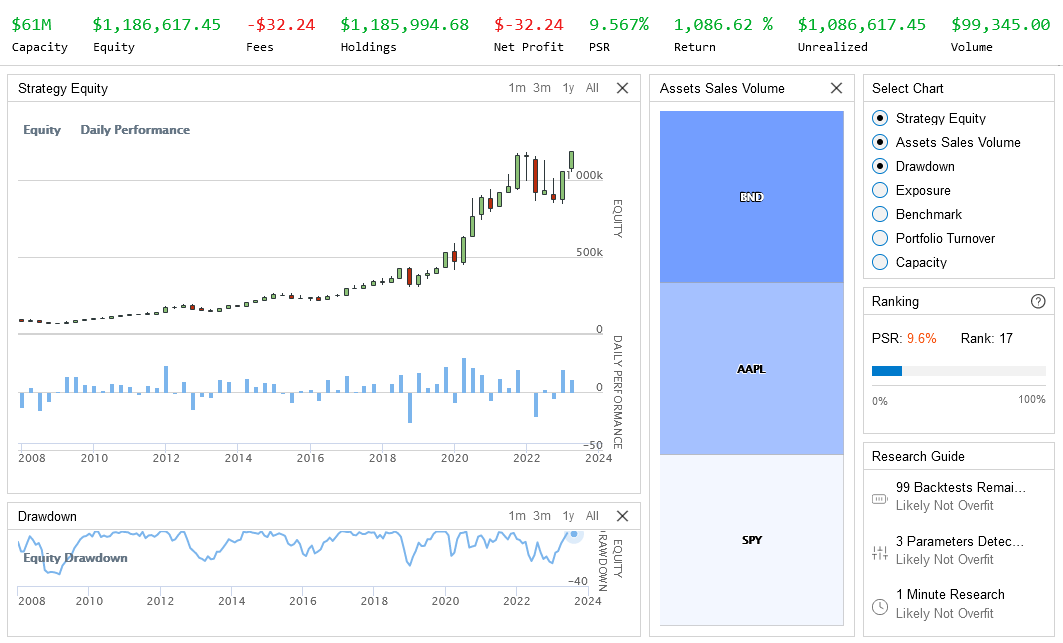
7. Visualize Results: Use equity curves and drawdown graphs to visualize performance over time. This helps identify periods of underperformance.
8. Compare to Benchmarks: Measure the strategy’s performance against a relevant benchmark, such as a market index, to gauge relative effectiveness.
By focusing on these areas, you can effectively interpret backtesting results for your day trading strategies.
Why is backtesting important for day trading?
Backtesting is crucial for day trading because it allows traders to evaluate the effectiveness of their strategies using historical data. By simulating trades based on past market conditions, traders can identify potential profitability and risk levels. Interpreting backtesting results helps in fine-tuning strategies, optimizing entry and exit points, and understanding drawdowns. It also builds confidence in a strategy before risking real capital. Key metrics like win rate, risk-reward ratio, and maximum drawdown are essential for assessing strategy viability.
What key metrics should I look for in backtesting results?
Focus on these key metrics in backtesting results for day trading:
1. Win Rate: Percentage of profitable trades compared to total trades.
2. Average Win vs. Average Loss: Compare the average profit of winning trades to the average loss of losing trades.
3. Risk-Reward Ratio: Measure the potential profit against the potential loss for each trade.
4. Maximum Drawdown: The largest peak-to-trough drop in your account balance during the backtest period.
5. Sharpe Ratio: Indicates risk-adjusted return; higher values suggest better risk management.
6. Number of Trades: Ensure a sufficient sample size for reliability.
7. Profit Factor: Total profit divided by total loss; a ratio above 1 indicates profitability.
These metrics provide a clear picture of strategy effectiveness and risk management.
How do I analyze win rate in backtesting outcomes?
To analyze win rate in backtesting outcomes, follow these steps:
1. Calculate Win Rate: Divide the number of winning trades by the total number of trades, then multiply by 100 for a percentage.
2. Assess Trade Quality: Look at the average profit of winning trades versus the average loss of losing trades. A high win rate is less meaningful if losses are significantly larger.
3. Consider Market Conditions: Evaluate how different market conditions affected your win rate. Split results by bullish, bearish, and sideways markets.
4. Review Trade Frequency: High win rates can be misleading if based on few trades. Ensure you have a statistically significant sample size.
5. Analyze Timing: Examine the timing of trades. Did certain times of day yield better win rates?
6. Use Additional Metrics: Combine win rate analysis with other metrics like profit factor and maximum drawdown for a comprehensive view.
7. Adjust Strategies: If the win rate is low, consider tweaking your strategy. Look for patterns in losing trades to identify areas for improvement.
By focusing on these elements, you'll gain a clearer understanding of your backtesting results and how to refine your day trading strategies.
What does maximum drawdown mean in day trading backtesting?
Maximum drawdown in day trading backtesting refers to the largest decline in the account balance from a peak to a trough during the testing period. It measures the worst-case loss a trader would have experienced. A smaller maximum drawdown indicates a more stable trading strategy, while a larger drawdown suggests higher risk. Understanding this metric helps traders assess the risk associated with their strategies and make informed decisions.
How can I evaluate risk-reward ratios from backtesting?
To evaluate risk-reward ratios from backtesting in day trading, follow these steps:
1. Define Risk and Reward: Identify your entry point, stop-loss level (risk), and target price (reward) for each trade.
2. Calculate Ratios: Use the formula: Risk-Reward Ratio = (Target Price – Entry Price) / (Entry Price – Stop-Loss Price).
3. Analyze Results: Review your backtest results to see how many trades hit the target versus those that hit the stop-loss.
4. Aggregate Data: Calculate the average risk-reward ratio across all trades to understand overall performance.
5. Adjust Strategies: If the ratio is consistently low, consider adjusting your entry and exit strategies to improve potential rewards relative to risk.
6. Use Visuals: Graphs can help visualize successful trades versus losses, highlighting effective strategies.
7. Consider Market Conditions: Evaluate how different market conditions affect your risk-reward ratios and adjust your backtesting scenarios accordingly.
What are common mistakes when interpreting backtesting results?
Common mistakes when interpreting backtesting results for day trading include:
1. Overfitting: Tailoring the strategy too closely to historical data can lead to poor performance in real markets.
2. Ignoring Market Conditions: Failing to account for different market environments can skew results.
3. Neglecting Transaction Costs: Not factoring in commissions and slippage can make a strategy appear more profitable than it is.
4. Assuming Future Performance: Believing past performance guarantees future results can lead to significant losses.
5. Inadequate Sample Size: Using too little data can produce misleading conclusions about a strategy’s effectiveness.
6. Confirmation Bias: Only considering results that support existing beliefs can lead to flawed decision-making.
7. Lack of Stress Testing: Not testing strategies under extreme conditions can overlook potential failures.
Address these pitfalls to accurately assess backtesting results in day trading.
How do I ensure my backtesting results are reliable?
To ensure your backtesting results are reliable, follow these steps:
1. Use a Robust Dataset: Ensure you have high-quality, comprehensive historical data that includes various market conditions.
2. Implement Proper Risk Management: Incorporate stop-loss orders and position sizing to reflect realistic trading scenarios.
3. Avoid Overfitting: Don’t tailor your strategy too closely to past data; it should perform well on unseen data too.
4. Test Across Different Timeframes: Validate your strategy on multiple timeframes to confirm its effectiveness.
5. Include Transaction Costs: Account for slippage and commissions in your backtesting to simulate real trading conditions accurately.
6. Run Multiple Simulations: Perform numerous backtests to gauge the consistency of your results.
7. Analyze Key Metrics: Look at metrics like the Sharpe ratio, drawdowns, and win/loss ratios to assess performance.
8. Stay Objective: Review results without bias; be willing to discard strategies that don’t perform as expected.
By following these guidelines, you can enhance the reliability of your backtesting results for day trading.
What role does the sample size play in backtesting accuracy?
Sample size in backtesting affects accuracy by determining the reliability of results. A larger sample size provides a more robust dataset, reducing the impact of random fluctuations and anomalies. It helps ensure that the trading strategy is tested across different market conditions and timeframes, leading to more credible conclusions. Conversely, a small sample size might produce misleading results, as it may not capture enough variability. For day trading, using a sufficiently large sample size enhances the confidence in the strategy’s effectiveness.
How can I adjust my strategy based on backtesting feedback?
To adjust your strategy based on backtesting feedback, first analyze the performance metrics like win rate, profit factor, and drawdown. Identify which trades were successful and which weren't; focus on the losing trades to understand what went wrong. Consider tweaking entry and exit points, adjusting stop-loss levels, or modifying position sizing. If certain market conditions consistently lead to losses, refine your strategy to avoid those scenarios. Finally, retest the adjusted strategy to ensure improvements before applying it in live trading.
What software tools are best for backtesting day trading strategies?
The best software tools for backtesting day trading strategies include:
1. TradingView – User-friendly with powerful charting capabilities and a wide range of indicators.
2. MetaTrader 4/5 – Offers extensive backtesting features with a large community for support.
3. Amibroker – Highly customizable and efficient for complex strategies.
4. NinjaTrader – Great for futures and forex traders, featuring advanced backtesting tools.
5. QuantConnect – Cloud-based platform suitable for algorithmic trading and backtesting.
6. Thinkorswim – Offers robust tools for backtesting with paper trading options.
Choose one based on your specific trading needs and the complexity of your strategies.
Learn about Best Tools for Day Trading Backtesting
How do different market conditions affect backtesting results?
Different market conditions, like trending versus ranging markets, significantly impact backtesting results for day trading. In a trending market, strategies may show high win rates as they capitalize on sustained price movements. However, in a ranging market, these same strategies might underperform due to frequent false signals and whipsaws.
Additionally, volatility influences outcomes; high volatility can lead to larger profits but also increases risk, while low volatility may result in smaller gains. Economic events and news can create sudden shifts that backtests can't predict, skewing results. Thus, always consider the current market environment when interpreting backtesting results to gauge a strategy's potential effectiveness accurately.
Learn about How Market Conditions Affect HFT Strategies
Should I trust backtesting results for future performance predictions?
Backtesting results can provide insights, but they shouldn't be fully trusted for future performance predictions. Markets change, and past performance doesn’t guarantee future results. Use backtesting as a tool to understand strategies, but combine it with ongoing analysis and risk management. Always stay adaptable and consider current market conditions when making trading decisions.
How can I incorporate slippage and commissions in backtesting?
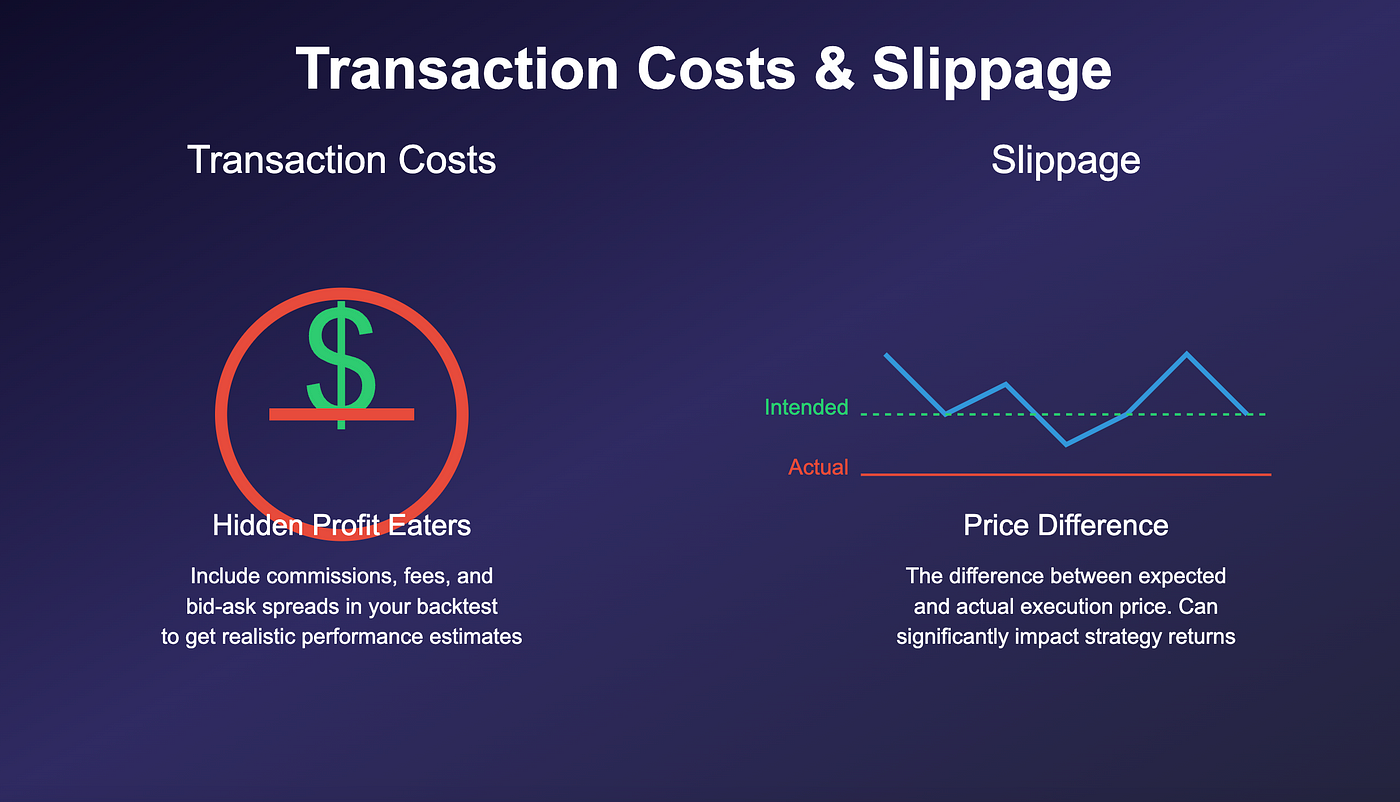
To incorporate slippage and commissions in backtesting for day trading, adjust your trade execution prices and overall performance calculations.
1. Slippage: Deduct a fixed amount from your entry and exit prices to simulate slippage. For example, if you expect an average slippage of $0.02, subtract that from your entry price and add it to your exit price.
2. Commissions: Subtract the total commission costs from your profits. If your broker charges $0.01 per share and you buy 1,000 shares, subtract $10 from your total profit.
3. Net Results: Always calculate your net profit/loss by factoring in both slippage and commissions to see the realistic performance of your strategy.
Using this method ensures your backtesting results more accurately reflect potential real-world trading outcomes.
What are the limitations of backtesting in day trading?
Backtesting in day trading has several limitations:
1. Historical Data Accuracy: Results depend on the quality and accuracy of historical data. Inaccurate data can lead to misleading conclusions.
2. Market Conditions: Backtesting may not account for changing market conditions. Strategies that worked in the past may not perform similarly in the future.
3. Overfitting: Traders might optimize strategies to fit historical data too closely, leading to poor performance in real-time trading.
4. Execution Delays: Backtests often ignore slippage and execution delays, which can significantly impact profitability in fast-moving markets.
5. Psychological Factors: Backtesting cannot simulate the emotional aspects of live trading, such as fear and greed, which can affect decision-making.
6. Parameter Sensitivity: Small changes in strategy parameters can lead to vastly different results, making it hard to trust the robustness of a strategy.
7. Transaction Costs: Many backtests overlook or underestimate transaction costs, which can erode profits in day trading.
Understanding these limitations is crucial for interpreting backtesting results effectively.
Conclusion about How to Interpret Backtesting Results for Day Trading
In conclusion, effectively interpreting backtesting results is crucial for developing successful day trading strategies. By understanding key metrics such as win rate, maximum drawdown, and risk-reward ratios, traders can make informed decisions and refine their approaches. Additionally, recognizing common pitfalls and ensuring the reliability of results are essential steps for accurate analysis. As you navigate the complexities of day trading, leveraging insights from DayTradingBusiness can enhance your understanding and application of backtesting, ultimately leading to improved trading performance.
Learn about How to Choose the Right Backtesting Software for Day Trading
Sources:
- Interagency Supervisory Guidance on Counterparty Credit Risk ...
- FRB: Supervisory Letter SR 09-1 on Application of the Market Risk ...
- A Profitable Day Trading Strategy For The US Equity Market
- A Review of Backtesting and Backtesting Procedures
- High-frequency lead-lag relationships in the Chinese stock index ...
- In-Sample vs. Out-Of-Sample Analysis of Trading Strategies