Did you know that the average day trader spends more time analyzing charts than some people spend watching their favorite TV series? In this article, we’ll dive into the essentials of day trading reversals, a crucial concept for traders looking to capitalize on market shifts. We’ll cover how to identify reversal patterns, the best indicators for spotting them, and the common types of reversals you should know. Additionally, you'll learn how candlestick patterns and volume play significant roles in these trades. We’ll discuss effective strategies, the importance of timing, and how to set stop losses to protect your capital. Finally, we’ll touch on psychological factors and common mistakes to avoid, ensuring you're well-equipped for your trading journey. Let DayTradingBusiness guide you through the intricacies of reversal trading for a stronger start in the markets.
What Are Day Trading Reversals?
Day trading reversals refer to price movements where an asset changes direction after a trend, signaling a potential shift in market momentum. Traders look for these reversals to capitalize on profit opportunities. Common reversal patterns include double tops, double bottoms, and head and shoulders. Indicators like RSI or MACD can help identify these points. Recognizing reversals is crucial for making informed trading decisions and managing risk.
How Do You Identify Reversal Patterns in Day Trading?
To identify reversal patterns in day trading, look for key formations like head and shoulders, double tops, double bottoms, and bullish or bearish engulfing candles. Monitor volume changes; increased volume often confirms a reversal. Use technical indicators like RSI or MACD to spot divergences. Pay attention to support and resistance levels, as reversals often occur at these points. Lastly, look for price action signals, such as pin bars or dojis, that indicate indecision or a shift in momentum.
What Indicators Help Spot Day Trading Reversals?
Key indicators to spot day trading reversals include:
1. Candlestick Patterns: Look for patterns like hammers, shooting stars, or engulfing candles that signal a potential reversal.
2. Support and Resistance Levels: Identify key price levels where the stock has historically reversed; these can indicate potential turning points.
3. Moving Averages: Watch for crossovers, especially when a short-term moving average crosses above or below a long-term average.
4. Relative Strength Index (RSI): An RSI above 70 may indicate overbought conditions, while below 30 suggests oversold conditions, signaling possible reversals.
5. MACD (Moving Average Convergence Divergence): Look for MACD line crossovers and divergence from price trends as signs of potential reversals.
6. Volume: Increased volume during a reversal pattern can confirm the strength of the move.
Using these indicators can enhance your ability to identify potential day trading reversals effectively.
What Are the Most Common Types of Reversal Patterns?
The most common types of reversal patterns in day trading are:
1. Head and Shoulders: Indicates a bullish-to-bearish reversal, featuring a peak (head) between two lower peaks (shoulders).
2. Inverse Head and Shoulders: Signals a bearish-to-bullish reversal, with a trough (head) between two higher troughs (shoulders).
3. Double Top: A bearish reversal pattern formed after an uptrend, characterized by two peaks at roughly the same price level.
4. Double Bottom: A bullish reversal pattern following a downtrend, marked by two troughs at similar price levels.
5. Triple Top: Similar to a double top, but with three peaks, indicating a strong reversal signal.
6. Triple Bottom: Like the double bottom, but with three troughs, suggesting a bullish reversal.
These patterns help traders identify potential trend reversals in the market.
How Can Candlestick Patterns Indicate Reversals?
Candlestick patterns can indicate reversals by showing price action and market sentiment. Key patterns like the Hammer, Shooting Star, and Engulfing patterns signal potential trend changes. For instance, a Hammer at the bottom of a downtrend suggests buyers are gaining strength, while a Shooting Star at the top indicates selling pressure. Look for confirmation with subsequent candles; a strong move in the opposite direction after a reversal pattern is a good sign. Always consider the overall market context and volume to enhance the reliability of these signals.
What Role Does Volume Play in Day Trading Reversals?
Volume is crucial in day trading reversals because it confirms the strength of a price change. High volume during a reversal indicates strong buying or selling interest, validating the new trend. Conversely, low volume can suggest a lack of conviction, making the reversal less reliable. Traders often look for spikes in volume as entry signals, helping to identify potential reversals with greater accuracy.
How Can News Events Trigger Reversal Patterns?
News events can trigger reversal patterns in day trading by causing sudden shifts in market sentiment. For instance, positive earnings reports can lead to bullish reversals, while negative news can spark bearish reversals. Traders react quickly to news, creating volatility that often breaks established trends. This volatility can form reversal patterns like double tops or bottoms, indicating a potential change in direction. Keeping an eye on economic indicators, corporate announcements, and geopolitical events can help traders anticipate these shifts and capitalize on them effectively.
What Are the Best Timeframes for Trading Reversals?
The best timeframes for trading reversals are typically the 15-minute, 30-minute, and 1-hour charts. These provide a balance between capturing quick movements and identifying significant reversal points. For beginners, starting with the 1-hour chart can help to spot clearer patterns while minimizing noise. As you gain experience, you can use the 15-minute and 30-minute charts for more precise entries. Always confirm reversals with indicators like RSI or candlestick patterns to increase success.
How Do You Set Stop Losses for Reversal Trades?
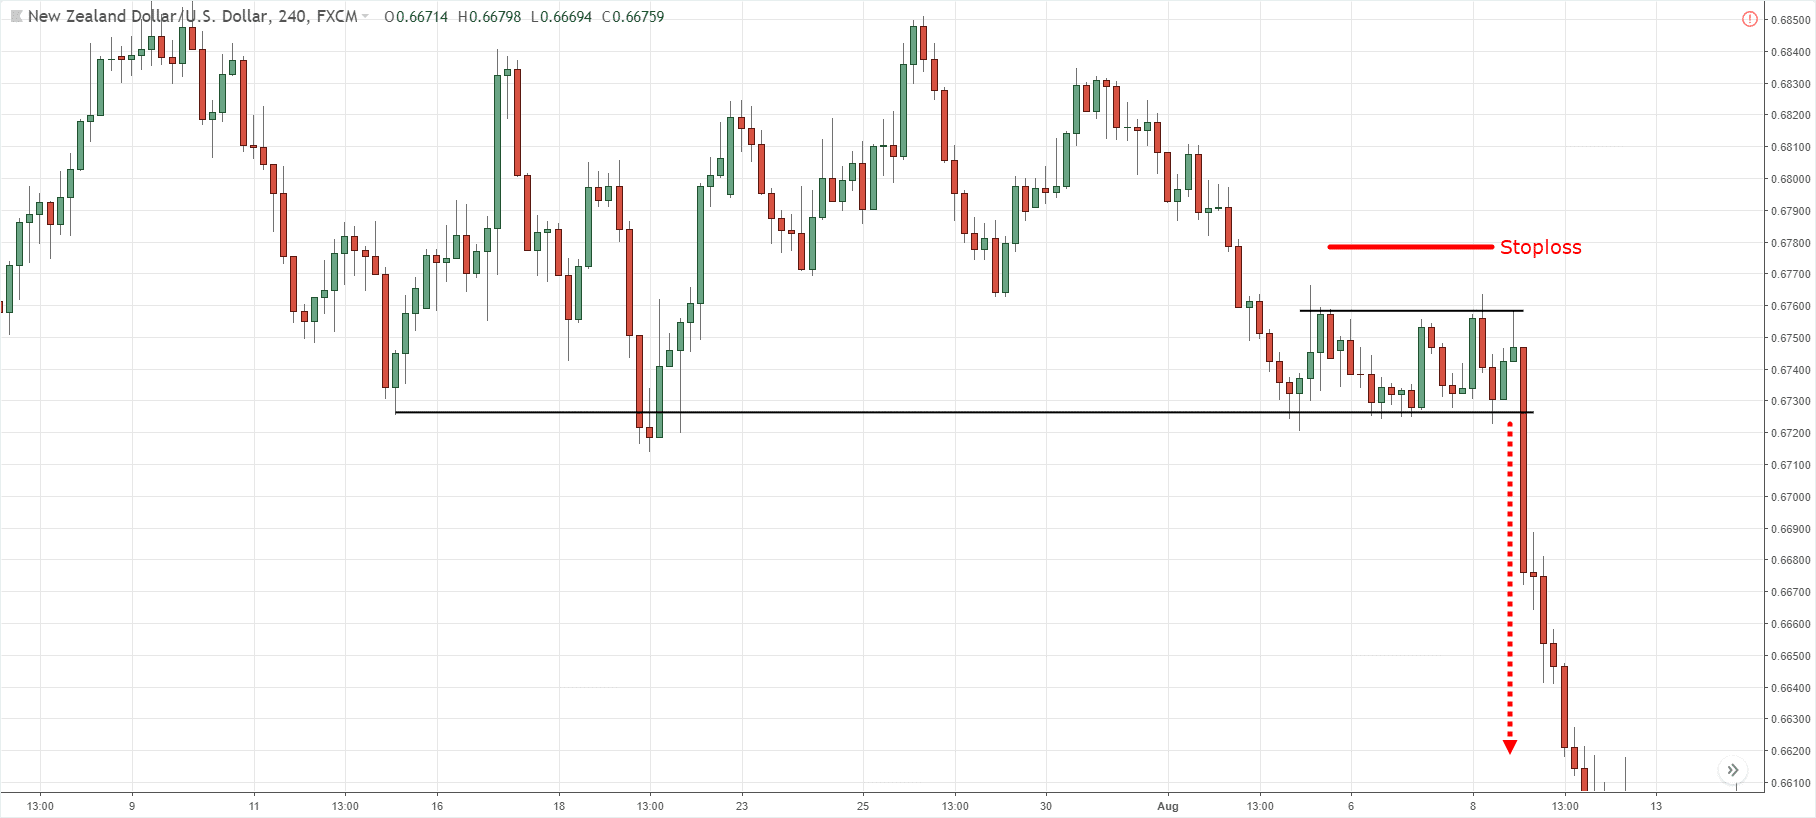
To set stop losses for reversal trades, first identify key support or resistance levels. Place your stop loss slightly above resistance for short trades or below support for long trades. Consider using a percentage of the entry price, typically between 1-3%, based on your risk tolerance. Additionally, use technical indicators like the Average True Range (ATR) to determine a suitable distance for your stop loss, ensuring it accommodates normal price fluctuations. Always reassess and adjust your stop loss as the trade progresses to lock in profits or minimize losses.
What Strategies Are Effective for Trading Reversals?
Effective strategies for trading reversals include:
1. Candlestick Patterns: Look for reversal patterns like hammers or engulfing candles at key support and resistance levels.
2. Divergence: Use indicators like RSI or MACD to spot divergence between price and momentum, signaling potential reversals.
3. Support and Resistance: Identify strong support and resistance zones where price has reversed in the past.
4. Trendline Breaks: Watch for breaks of trendlines that indicate a shift in momentum.
5. Volume Analysis: Increased volume on a reversal day can confirm the strength of the move.
6. Fibonacci Retracement: Use Fibonacci levels to find potential reversal points within trends.
7. News Events: Monitor economic news and earnings reports that can trigger sharp reversals.
Combine these strategies for a more robust approach to trading reversals.
How Do Market Trends Affect Reversal Trading?
Market trends significantly impact reversal trading by influencing entry and exit points. When a market is in a strong uptrend, traders look for signs of a reversal, such as overbought conditions or bearish candlestick patterns. Conversely, in a downtrend, they seek bullish signals like oversold conditions or bullish reversals. Understanding these trends helps traders identify potential reversal points, improving their chances of success. Additionally, trends define market sentiment, guiding traders on when to act or hold back.
Learn about How Do Market Makers and Liquidity Providers Affect Day Trading?
What Mistakes Should Beginners Avoid When Trading Reversals?
Beginners should avoid these mistakes when trading reversals:
1. Ignoring Market Trends: Don't trade against the prevailing trend without strong evidence of a reversal.
2. Lack of Risk Management: Always set stop-loss orders to protect your capital from unexpected moves.
3. Overtrading: Avoid jumping into multiple trades too quickly; focus on quality over quantity.
4. Emotional Trading: Keep emotions in check; stick to your strategy rather than acting on fear or greed.
5. Neglecting Technical Analysis: Use indicators and chart patterns to confirm reversal signals before entering trades.
6. Not Practicing Patience: Wait for confirmation of a reversal instead of acting on a hunch.
7. Ignoring News Events: Be aware of economic reports or news that can impact market movements.
By steering clear of these pitfalls, beginners can improve their chances of successful reversal trading.
How Can Technical Analysis Aid in Reversal Trading?
Technical analysis aids in reversal trading by identifying key price levels, patterns, and indicators that signal potential market reversals. Traders use tools like support and resistance levels to pinpoint areas where price might change direction. Chart patterns, such as head and shoulders or double tops/bottoms, indicate shifts in market sentiment. Indicators like the Relative Strength Index (RSI) or Moving Average Convergence Divergence (MACD) help confirm overbought or oversold conditions, suggesting a reversal may occur. By combining these elements, traders can make informed decisions on when to enter or exit trades, enhancing their chances of profiting from market reversals.
What are Effective Day Trading Reversal Strategies for Beginners?
Day trading reversals involve identifying points where a security's price trend changes direction. Common strategies include using candlestick patterns, support and resistance levels, and technical indicators like RSI or MACD. Focus on volume and market sentiment to confirm reversal signals.
Learn more about: Understanding Day Trading Reversal Strategies
Learn about Backtesting Strategies for Effective Day Trading
What Psychological Factors Influence Reversal Trading?
Psychological factors influencing reversal trading include fear of loss, greed, and overconfidence. Traders often hesitate to enter a position due to fear of losing money, leading to missed opportunities. Greed can push traders to hold onto positions longer than they should, hoping for more profit. Overconfidence may cause traders to ignore market signals, believing they can predict reversals without proper analysis. Additionally, herd mentality can lead to impulsive decisions, as traders follow the crowd rather than sticking to their strategy. Understanding these psychological influences is crucial for effective reversal trading.
How Do You Manage Risk When Day Trading Reversals?
To manage risk when day trading reversals, use these strategies:
1. Set Stop-Loss Orders: Place stop-loss orders just above resistance or below support levels to limit potential losses.
2. Position Sizing: Determine how much of your capital to risk on each trade, typically no more than 1-2% of your total account.
3. Use Technical Indicators: Employ indicators like RSI or MACD to identify overbought or oversold conditions, helping you spot potential reversals.
4. Trend Confirmation: Wait for confirmation of a reversal with price action or volume before entering a trade.
5. Diversify Trades: Avoid putting all your capital into one trade; diversify across different assets.
6. Emotional Discipline: Stick to your trading plan and avoid impulsive decisions, especially after losses.
7. Review and Adjust: Regularly analyze your trades to identify patterns and adjust your strategy accordingly.
Implementing these techniques can help you effectively manage risk in day trading reversals.
Learn about How to manage leverage risk when day trading?
What Resources Are Available for Learning Reversal Trading?
To learn reversal trading, explore these resources:
1. Books: "The New Trading for a Living" by Dr. Alexander Elder and "A Beginner's Guide to Forex Trading" by Matthew Driver.
2. Online Courses: Platforms like Udemy and Coursera offer courses specifically on trading reversals.
3. YouTube Channels: Follow channels like "Warrior Trading" and "Trading 212" for practical tutorials and strategies.
4. Trading Communities: Join forums like Trade2Win or Reddit's r/Daytrading for discussions and shared experiences.
5. Demo Accounts: Use platforms like Thinkorswim or TradingView to practice reversal strategies without financial risk.
6. Webinars: Attend webinars hosted by experienced traders that focus on reversal trading techniques.
These resources will help you grasp the concepts and strategies essential for successful reversal trading.
Conclusion about Day Trading Reversals: A Beginner’s Guide
Understanding day trading reversals is crucial for any aspiring trader. By identifying reversal patterns, utilizing key indicators, and recognizing market influences, you can enhance your trading strategy. Effective management of risk, alongside the application of technical analysis, will further bolster your success. For beginners, avoiding common pitfalls and focusing on psychological factors can improve your trading performance. With the right resources and strategies, you can confidently navigate the complexities of reversal trading. For in-depth guidance and support, DayTradingBusiness is here to help you master these essential concepts.
Learn about Beginner’s Guide to Day Trading Options