Did you know that even the most seasoned traders sometimes flip a coin to make a decision? While that might not be the best strategy, identifying market reversals certainly is! In this article, we delve into advanced techniques for reversal trading, covering essential concepts like key indicators, candlestick patterns, and the crucial role of volume. Learn how moving averages, support and resistance, and Fibonacci retracement levels can enhance your analysis. We'll also explore effective strategies, the psychological factors at play, and how news events can create opportunities. Plus, discover tools for backtesting and risk management to refine your approach. With insights from DayTradingBusiness, you’ll be equipped to master reversal trading with confidence.
What is reversal trading and how does it work?
Reversal trading is a strategy where traders bet against the current trend, anticipating a price reversal. It works by identifying potential turning points in the market using indicators like RSI, MACD, or candlestick patterns. Traders look for overbought or oversold conditions, signaling a likely shift in momentum. For example, if a stock is in a downtrend but shows signs of support at a key level, a trader might enter a long position, expecting a reversal to an uptrend. Timing is crucial; traders often set stop-loss orders to manage risk.
What are the key indicators for identifying reversal points?
Key indicators for identifying reversal points include:
1. Support and Resistance Levels: Look for price levels where the market has previously reversed.
2. Candlestick Patterns: Patterns like hammers, engulfing candles, or dojis can signal potential reversals.
3. Divergence: When price moves in one direction but indicators like RSI or MACD move in the opposite direction, it suggests a reversal.
4. Moving Averages: Crossovers, especially with short-term and long-term moving averages, can indicate a shift in trend.
5. Volume: Increasing volume at reversal points can confirm the strength of the reversal.
6. Fibonacci Retracement Levels: Price often reverses at key Fibonacci levels (23.6%, 38.2%, 61.8%).
7. Trendline Breaks: A break of established trendlines can signal a potential reversal.
These indicators can help traders effectively identify potential reversal points in the market.
How can candlestick patterns signal reversals in trading?
Candlestick patterns signal reversals by indicating shifts in market sentiment. For example, a "hammer" pattern at the bottom of a downtrend suggests buyers are stepping in, signaling a potential reversal to the upside. Conversely, a "shooting star" at the top of an uptrend indicates selling pressure, hinting at a possible downturn. Patterns like "engulfing" and "doji" also reflect indecision or strong reversals when they appear at key support or resistance levels. Traders often combine these patterns with volume analysis and trend lines for more reliable signals.
What role does volume play in reversal trading strategies?
Volume is crucial in reversal trading strategies as it confirms the strength of a potential price reversal. High volume during a price decline or increase signals strong interest and can indicate that the trend is losing momentum. Traders look for volume spikes at key support or resistance levels to validate their reversal signals. Low volume during a price move suggests weakness, making the reversal more likely. Overall, analyzing volume helps traders make informed decisions about entry and exit points in reversal trading.
How do moving averages help in spotting reversals?
Moving averages help in spotting reversals by smoothing out price data, making trends clearer. When the price crosses above a moving average, it may signal a bullish reversal. Conversely, a price drop below the moving average could indicate a bearish reversal. Traders often look for crossovers between short-term and long-term moving averages to identify potential trend changes. Additionally, the convergence and divergence of moving averages can highlight weakening momentum, prompting traders to consider reversals.
What is the significance of support and resistance in reversals?
Support and resistance levels are crucial in reversal trading because they identify points where price action is likely to change direction. When the price approaches a support level, it often bounces back up, signaling a potential reversal from a downtrend. Conversely, reaching a resistance level may indicate a reversal from an uptrend as sellers step in. Recognizing these levels helps traders anticipate market moves and make informed decisions about entries and exits, enhancing the effectiveness of reversal strategies.
How do Fibonacci retracement levels aid in reversal analysis?
Fibonacci retracement levels help identify potential reversal points in trading by highlighting key price levels where an asset might bounce or reverse direction. Traders use these levels—commonly 23.6%, 38.2%, 50%, 61.8%, and 100%—to assess where price corrections might occur after a trend. When the price approaches these levels, it often indicates increased buying or selling pressure, signaling a possible reversal. By combining Fibonacci levels with other technical indicators, traders can enhance their reversal analysis and improve decision-making.
What are the most effective reversal trading strategies?
The most effective reversal trading strategies include:
1. Candlestick Patterns: Look for formations like the hammer, shooting star, or engulfing patterns at key support or resistance levels.
2. Divergence: Use indicators like RSI or MACD to spot divergences between price and momentum, signaling potential reversals.
3. Fibonacci Retracement: Identify reversal points using Fibonacci levels, especially at 38.2%, 50%, and 61.8%.
4. Moving Average Crossovers: Look for crossovers between short-term and long-term moving averages as potential reversal signals.
5. Trendline Breaks: Monitor for breakouts from established trendlines, which can indicate a reversal.
6. Volume Analysis: Increased volume during a price reversal adds credibility to the move.
7. Support and Resistance Zones: Trade near these levels where price has historically reversed, enhancing the likelihood of a successful trade.
Utilize these strategies in conjunction with proper risk management for effective reversal trading.
How can traders use RSI for detecting market reversals?
Traders can use the Relative Strength Index (RSI) to detect market reversals by identifying overbought or oversold conditions. When the RSI exceeds 70, it suggests overbought conditions, signaling a potential price reversal downward. Conversely, an RSI below 30 indicates oversold conditions, hinting at a possible upward reversal.
Additionally, traders look for divergence between price action and RSI. If prices reach new highs while the RSI forms lower highs, it signals weakening momentum and a potential reversal. Similarly, if prices hit new lows but the RSI shows higher lows, it indicates bullish reversal potential.
Combining RSI signals with other indicators, like support and resistance levels or candlestick patterns, can enhance the reliability of reversal predictions.
What are the advanced techniques for effective day trading reversal strategies?
Understanding day trading reversal strategies involves recognizing market trends and identifying potential turning points. Advanced techniques for reversal trading include using candlestick patterns, momentum indicators, and support and resistance levels to determine entry and exit points.
Learn more about: Understanding Day Trading Reversal Strategies
Learn about Advanced Techniques for Indicator Analysis in Day Trading
What are the psychological factors behind reversal trading?
Reversal trading hinges on several psychological factors. Traders often succumb to herd mentality, following trends until they become overextended. Fear of missing out (FOMO) drives many to chase prices, leading to eventual exhaustion. Once momentum shifts, emotions like fear and greed trigger rapid decision-making, causing traders to seek reversals.
Confirmation bias plays a role, as traders look for evidence to support their reversal trades while ignoring contrary signals. Additionally, loss aversion makes traders hold onto losing positions longer, hoping for a rebound. Understanding these psychological elements can enhance your strategy in reversal trading.
How do news events impact reversal trading opportunities?
News events significantly impact reversal trading opportunities by creating volatility and sudden price movements. When unexpected news breaks, it can lead to sharp reversals as traders react to the information. For example, positive earnings reports might cause a stock that was in a downtrend to reverse and rally. Conversely, negative news can lead to sell-offs, presenting short-selling opportunities for reversal traders. Monitoring economic indicators and company news is crucial, as these events often serve as catalysts for identifying potential reversal points in the market.
Learn about How News Events Impact Day Trading Decisions
What tools and software can assist with reversal trading?
Tools and software that assist with reversal trading include:
1. Charting Software: Platforms like TradingView or MetaTrader provide advanced charting tools for identifying reversal patterns.
2. Technical Indicators: Use indicators such as RSI, MACD, and Bollinger Bands to spot potential reversals.
3. Market Scanners: Tools like Finviz or Trade Ideas can help detect stocks or assets showing reversal signals based on set criteria.
4. Backtesting Software: Programs like Amibroker or NinjaTrader allow you to test reversal strategies on historical data.
5. News Aggregators: Tools like Benzinga or Seeking Alpha can keep you updated on market news that may trigger reversals.
6. Automated Trading Systems: Consider using platforms like Tradestation for algorithmic trading based on reversal strategies.
Each of these can enhance your ability to identify and act on reversal trading opportunities effectively.
How can backtesting improve reversal trading strategies?
Backtesting enhances reversal trading strategies by allowing traders to test their strategies against historical data. This process identifies the effectiveness of entry and exit points, helping to refine trade parameters. It reveals patterns and market conditions where reversals are more likely to succeed, enabling better risk management. By analyzing past performance, traders can optimize their strategies, improve their win rates, and build confidence in their trading decisions.
Learn about How to Use Backtesting to Improve Your Day Trading Performance
What are the common mistakes to avoid in reversal trading?
Common mistakes to avoid in reversal trading include:
1. Ignoring Market Context: Failing to consider overall market trends can lead to poor entry points.
2. Lack of Risk Management: Not setting stop-loss orders can result in significant losses.
3. Overtrading: Taking too many positions based on emotions rather than analysis can diminish profits.
4. Chasing Losses: Trying to recover losses quickly often leads to further losses.
5. Neglecting Confirmation Signals: Entering trades without confirming reversal signals can lead to false breakouts.
6. Inadequate Research: Trading without understanding the underlying asset can result in uninformed decisions.
7. Ignoring Volume: Low trading volume during a reversal can indicate a lack of strength in the price movement.
Avoiding these pitfalls can enhance your reversal trading strategy significantly.
How do you manage risk when trading reversals?
To manage risk when trading reversals, use these techniques:
1. Set Stop-Loss Orders: Place stop-loss orders just outside key support or resistance levels to limit potential losses.
2. Position Sizing: Calculate your position size based on your risk tolerance, usually 1-2% of your trading capital.
3. Identify Divergence: Look for divergence between price and indicators like RSI or MACD to confirm potential reversals.
4. Use Multiple Time Frames: Analyze different time frames to confirm reversal signals, ensuring you’re not trading against the overall trend.
5. Monitor News Events: Stay aware of economic news that could impact market sentiment and trigger unexpected moves.
6. Practice Risk-Reward Ratios: Aim for a favorable risk-reward ratio, ideally at least 1:2, to ensure that potential rewards justify the risks.
7. Review Historical Patterns: Study previous reversal patterns and their outcomes to improve your decision-making.
Implementing these strategies can enhance your risk management when trading reversals.
Learn about How to manage leverage risk when day trading?
What are the best practices for executing reversal trades?
1. Identify key support and resistance levels: Use these to spot potential reversal points.
2. Use technical indicators: Look for signals like MACD crossovers or RSI divergences that suggest a reversal.
3. Confirm with volume: Ensure that volume increases during the reversal to validate the move.
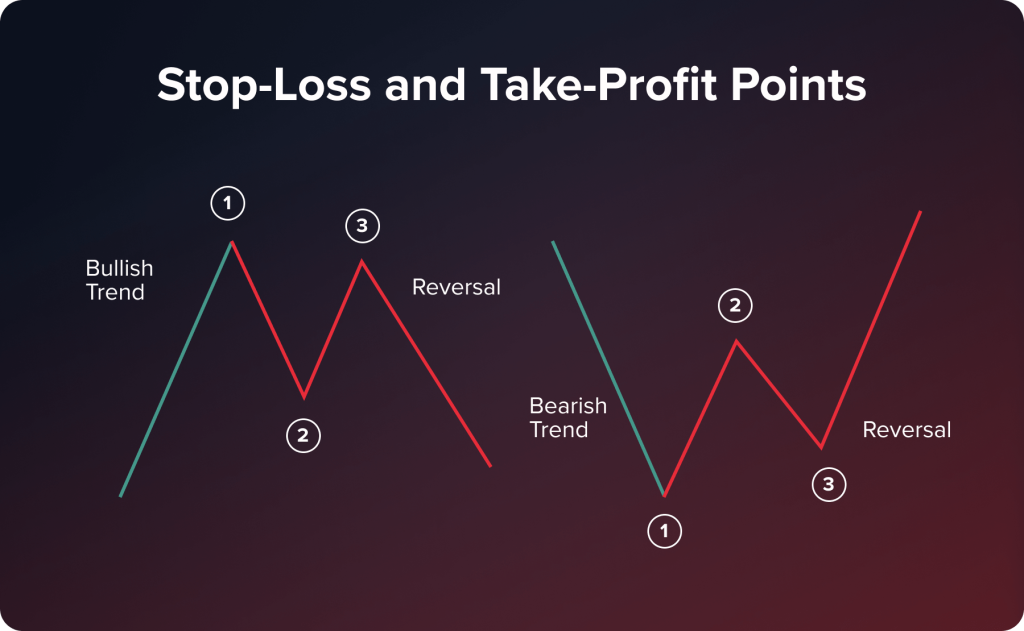
4. Set clear entry and exit points: Define your stop-loss and take-profit levels before entering the trade.
5. Manage risk: Use appropriate position sizing to protect your capital.
6. Monitor market sentiment: Stay aware of news and events that could impact the trend.
7. Practice patience: Wait for confirmation signals before executing the trade to avoid false reversals.
8. Keep a trading journal: Document your trades to analyze what works and refine your strategy.
Conclusion about Advanced Techniques for Reversal Trading
In summary, mastering advanced techniques for reversal trading requires a keen understanding of market indicators, candlestick patterns, and the psychological factors at play. Utilizing tools such as moving averages, Fibonacci retracement levels, and volume analysis can significantly enhance your ability to identify potential reversal points. By implementing effective strategies, managing risk, and avoiding common pitfalls, traders can optimize their reversal trading approach. For more in-depth insights and guidance on navigating these complexities, DayTradingBusiness is here to support your trading journey.