Did you know that traders have been known to lose more money trying to outsmart their coffee machines than in the stock market? In day trading, it's crucial to have a solid strategy backed by key metrics. This article dives into essential metrics such as risk-reward ratio, win rate, and average profit per trade, helping you evaluate your day trading strategy effectively. We’ll also explore the significance of maximum drawdown, trading costs, and emotional factors, ensuring you avoid common pitfalls and adapt your approach based on market conditions. For beginners, we’ll highlight the most important metrics to focus on for successful trading. Let DayTradingBusiness guide you through the numbers that matter!
What are the key metrics to evaluate a day trading strategy?
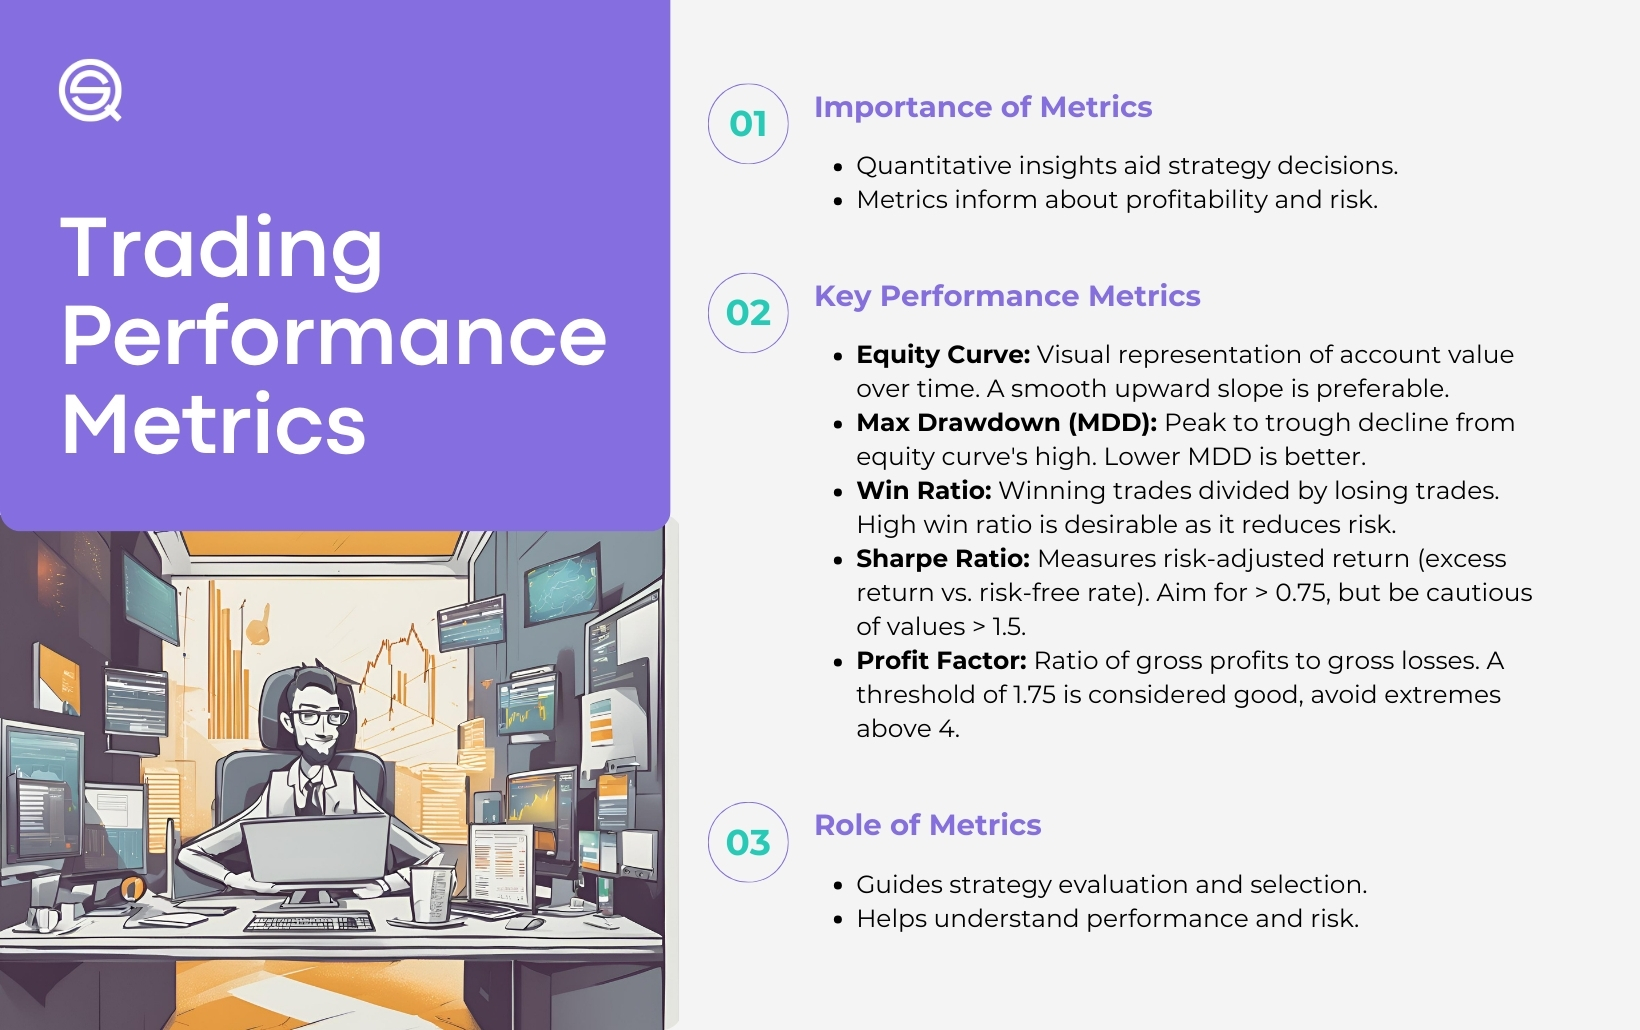
The key metrics to evaluate a day trading strategy include:
1. Win Rate: The percentage of profitable trades versus total trades.
2. Risk-Reward Ratio: The average profit per trade compared to the average loss.
3. Average Profit and Loss: The mean gains from winning trades and mean losses from losing trades.
4. Maximum Drawdown: The largest peak-to-trough decline in account balance over a specific period.
5. Return on Investment (ROI): The percentage return on capital invested.
6. Sharpe Ratio: Measures risk-adjusted return, comparing excess return to volatility.
7. Trade Frequency: How often trades are executed within a given timeframe.
These metrics help assess the effectiveness and risk of your day trading strategy.
How do you measure risk-reward ratio in day trading?
To measure the risk-reward ratio in day trading, follow these steps:
1. Identify Entry and Exit Points: Determine your entry price and your target exit price for a trade.
2. Calculate Risk: Find the difference between your entry price and your stop-loss price. This is your potential loss.
3. Calculate Reward: Find the difference between your target exit price and your entry price. This is your potential profit.
4. Divide Reward by Risk: Use the formula: Risk-Reward Ratio = Potential Profit / Potential Loss.
For example, if your entry is $100, your stop-loss is $95 (risk of $5), and your target is $110 (reward of $10), then your risk-reward ratio is 10:5 or 2:1.
Aim for a ratio of at least 2:1 to ensure that your potential reward justifies the risk taken.
What is the significance of win rate in day trading?
Win rate in day trading measures the percentage of profitable trades out of total trades. A higher win rate indicates a more effective trading strategy, helping traders identify successful patterns and refine decision-making. However, win rate alone doesn’t determine profitability; it's essential to consider risk-reward ratio and overall trading strategy. Balancing win rate with these metrics ensures a sustainable approach to day trading.
How can you calculate average profit per trade in day trading?
To calculate average profit per trade in day trading, follow these steps:
1. Record Trades: Keep a detailed log of each trade, noting the profit or loss for each.
2. Sum Profits and Losses: Add up all the profits from winning trades and subtract the total losses from losing trades.
3. Count Total Trades: Determine the total number of trades executed during the period.
4. Calculate Average: Divide the net profit (total profits minus total losses) by the total number of trades.
The formula is:
Average Profit per Trade = (Total Profits – Total Losses) / Total Trades.
This provides a clear metric to evaluate your day trading strategy's effectiveness.
Why is the maximum drawdown important for day traders?
Maximum drawdown is crucial for day traders because it measures the largest peak-to-trough loss in their trading capital. This metric helps traders understand risk exposure and assess the effectiveness of their strategies. A lower maximum drawdown indicates better risk management and potential for recovery, which is vital in the fast-paced day trading environment. By analyzing maximum drawdown, traders can refine their tactics, set realistic profit targets, and maintain emotional discipline during losing streaks. Ultimately, it’s a key indicator of overall trading performance and sustainability.
How do you assess the volatility of your day trading strategy?
To assess the volatility of your day trading strategy, monitor the average true range (ATR), standard deviation of returns, and the Sharpe ratio. Analyze your maximum drawdown to understand risk exposure. Track win/loss ratios and the consistency of returns over time. Use backtesting on historical data to evaluate how your strategy performs under varying market conditions. Lastly, keep an eye on market news and events that could influence volatility.
What are the best performance metrics for day trading?

The best performance metrics for day trading include:
1. Win Rate: The percentage of profitable trades compared to total trades.
2. Risk-Reward Ratio: The average profit per trade divided by the average loss per trade.
3. Average Trade Duration: The average time you hold a position.
4. Sharpe Ratio: Measures risk-adjusted return; higher values indicate better performance relative to risk.
5. Maximum Drawdown: The largest drop from a peak to a trough in your portfolio value.
6. Profit Factor: The ratio of gross profit to gross loss; above 1 indicates profitability.
7. Total Return: The overall percentage gain or loss over a specific period.
Use these metrics to analyze and refine your trading strategy effectively.
How do trading costs affect day trading strategy evaluation?
Trading costs significantly impact day trading strategy evaluation by directly affecting profitability. High commissions, spreads, and slippage can erode gains from successful trades. When assessing your strategy, consider these costs in your profit calculations. Use metrics like net profit margin and return on investment to factor in trading expenses. A strategy that appears profitable before costs might be unviable once trading fees are included. Always incorporate a realistic estimation of trading costs to ensure an accurate evaluation of your day trading strategy.
What metrics should beginners use to evaluate their day trading strategies?
To evaluate your day trading strategy, focus on these key metrics:
1. **Win Rate**: Percentage of profitable trades versus total trades.
2. **Risk-Reward Ratio**: Average profit per trade divided by average loss per trade.
3. **Average Gain/Loss**: Average profit on winning trades versus average loss on losing trades.
4. **Maximum Drawdown**: The largest drop from a peak to a trough in your trading account.
5. **Sharpe Ratio**: Measures risk-adjusted return; higher is better.
6. **Average Trade Duration**: Time you hold trades, indicating your strategy's speed.
These metrics will help you assess and refine your day trading strategy effectively.
Learn more about: Day Trading Strategies for Beginners
What role does trade frequency play in day trading performance?
Trade frequency significantly impacts day trading performance by influencing potential profits and risk management. Higher frequency can lead to more opportunities for gains, but it also increases transaction costs and the risk of quick losses. Striking a balance is essential; too few trades may result in missed opportunities, while too many can lead to overtrading and emotional fatigue. Evaluating your strategy with metrics like win rate and average return per trade can help determine the optimal trade frequency for maximizing performance.
Learn about What Role Does Compliance Play in Day Trading Platform Certification?
How can you analyze your trading performance over time?

To analyze your trading performance over time, track key metrics such as win rate, average gain per trade, average loss per trade, and risk-reward ratio. Maintain a trading journal to record each trade's details, including entry and exit points, reasons for the trade, and emotional state. Regularly review your journal to identify patterns, strengths, and weaknesses. Calculate your total return on investment (ROI) and compare it against benchmarks. Assess your drawdowns to understand risk exposure. Use performance analysis tools or software to visualize trends and improve your day trading strategy.
Learn about How to Analyze Day Trading Performance
What metrics should beginners focus on for day trading?
Beginners in day trading should focus on these key metrics:
1. Win Rate: Percentage of profitable trades versus total trades. Aim for a win rate above 50%.
2. Risk-to-Reward Ratio: Compare potential profit to potential loss on trades. A ratio of at least 1:2 is ideal.
3. Average Gain/Loss: Track the average amount you gain on winning trades versus what you lose on losing trades.
4. Position Size: Determine how much capital to risk on each trade, typically 1-2% of your trading account.
5. Total Trades: Monitor the number of trades executed over a specific period to evaluate activity levels.
6. Daily Performance: Analyze daily profit or loss to gauge overall trading effectiveness.
7. Volatility: Assess the price fluctuations of stocks to identify suitable trading opportunities.
Focusing on these metrics will help beginners refine their day trading strategies.
How do you use backtesting to evaluate a day trading strategy?
To evaluate a day trading strategy using backtesting, follow these steps:
1. Collect Historical Data: Gather price data for the assets you plan to trade, including open, high, low, and close prices.
2. Define Strategy Rules: Clearly entry and exit points, risk management, and position sizing.
3. Run the Backtest: Apply your strategy to the historical data using trading software or a programming language like Python.
4. Analyze Key Metrics:
– Win Rate: Percentage of profitable trades.
– Profit Factor: Ratio of gross profit to gross loss.
– Maximum Drawdown: Largest peak-to-trough decline to assess risk.
– Average Trade Return: Mean profit or loss per trade.
5. Adjust Parameters: Tweak your strategy based on the backtest results, looking for improvements without overfitting.
6. Validate Results: Use additional data sets or walk-forward testing to ensure robustness.
7. Document Findings: Keep a record of your results to refine your strategy continuously.
This structured approach helps you gauge the effectiveness and potential profitability of your day trading strategy before risking real money.
Learn about How to Use Backtesting to Improve Your Day Trading Performance
What is the importance of risk management metrics in day trading?

Risk management metrics in day trading are crucial because they help traders quantify potential losses, assess the effectiveness of their strategies, and maintain discipline. Key metrics like the risk-reward ratio, stop-loss levels, and position sizing ensure that traders are not risking more than they can afford to lose. These metrics guide decision-making, allowing traders to enter and exit positions with a clear understanding of their risk exposure. By focusing on these metrics, day traders can protect their capital, optimize their profitability, and improve their overall trading performance.
Learn about How can poor risk management lead to losses in day trading?
How can you track emotional factors in your day trading metrics?
To track emotional factors in your day trading metrics, keep a trading journal where you note your feelings before, during, and after trades. Include metrics like decision-making time, risk tolerance, and emotional triggers. Use a mood tracker to assess how emotions influence your trading performance. Review your journal regularly to identify patterns between your emotional state and trading outcomes. This reflection helps adjust your strategy to improve emotional resilience and decision-making.
Learn about How Do Brokers Track and Report Day Trading Activity?
What are common pitfalls in evaluating day trading strategies?
Common pitfalls in evaluating day trading strategies include:
1. Overemphasis on Historical Performance: Relying too much on past results can mislead you about future performance.
2. Ignoring Risk Management: Focusing solely on profit without considering risk can lead to significant losses.
3. Neglecting Market Conditions: Strategies that worked in one market environment may fail in another.
4. Lack of Consistency: Evaluating strategies only over short periods can give a skewed view of effectiveness.
5. Failure to Adapt: Sticking to a strategy despite changing market conditions can be detrimental.
6. Not Accounting for Fees: Ignoring transaction costs can inflate perceived profitability.
7. Confirmation Bias: Only looking for data that supports your strategy while dismissing contrary evidence can lead to poor decisions.
8. Emotional Decision-Making: Letting emotions influence evaluations can cloud judgment and lead to poor strategy assessments.
Addressing these pitfalls can lead to a more accurate evaluation of your day trading strategy.
How do you adjust your metrics based on market conditions?
Adjust your metrics based on market conditions by regularly analyzing volatility, volume, and price trends. In a bullish market, focus on metrics like momentum and breakout patterns; in a bearish market, prioritize risk management and stop-loss orders. Use moving averages to gauge market direction and adjust your profit targets accordingly. During high volatility, consider widening stop-loss limits to avoid premature exits. Regularly review your trade success rates and adapt your strategy based on changing conditions to stay aligned with market dynamics.
Conclusion about Metrics to Evaluate Your Day Trading Strategy
In conclusion, effectively evaluating your day trading strategy requires a comprehensive understanding of various performance metrics, such as risk-reward ratio, win rate, and maximum drawdown. By focusing on these key indicators, including trading costs and emotional factors, you can gain valuable insights into your trading performance. Utilizing backtesting and adjusting metrics based on market conditions further enhances your strategy evaluation. Continuous learning and adaptation are essential for successful day trading. For more in-depth guidance and resources, DayTradingBusiness is here to support your trading journey.
Learn about Key Metrics to Evaluate Day Trading Algorithms