Did you know that the average day trader spends more time analyzing charts than a chef does perfecting a soufflé? In the fast-paced world of day trading, crafting a solid strategy based on technical analysis is essential for success. This article breaks down the fundamentals of creating an effective day trading strategy, covering key indicators, trend identification, and chart patterns. You'll learn how to set precise entry and exit points, manage risk, and leverage moving averages and volume for better decision-making. Additionally, we explore the psychological factors influencing trading success and the importance of backtesting your approach. With insights on the impact of news events and recommendations for tools and software, this guide from DayTradingBusiness equips both beginners and seasoned traders to refine their strategies and avoid common pitfalls.
What is a day trading strategy based on technical analysis?
A day trading strategy based on technical analysis involves using chart patterns, indicators, and price action to make buy and sell decisions within the same trading day.
1. Identify Trends: Use moving averages to determine the current trend direction. For example, if the price is above the 50-day moving average, consider buying.
2. Support and Resistance Levels: Recognize key support and resistance levels to set entry and exit points. Buy near support and sell near resistance.
3. Indicators: Utilize indicators like the Relative Strength Index (RSI) or MACD to identify overbought or oversold conditions. An RSI above 70 suggests selling, while below 30 indicates a potential buy.
4. Candlestick Patterns: Look for candlestick patterns such as dojis or engulfing patterns to signal reversals.
5. Volume Analysis: Confirm price movements with volume. An increase in volume on a breakout strengthens the trade's validity.
6. Risk Management: Set stop-loss orders to limit losses and calculate position sizes based on risk tolerance.
7. Backtesting: Test your strategy on historical data to ensure its effectiveness before applying it in real-time.
This strategy combines various technical analysis tools to make informed trading decisions.
How do I start day trading using technical analysis?
To start day trading using technical analysis, follow these steps:
1. Choose a Trading Platform: Select a reliable trading platform that offers advanced charting tools and real-time data.
2. Learn Key Indicators: Familiarize yourself with essential technical indicators like moving averages, RSI, MACD, and Bollinger Bands. These help identify trends and potential entry/exit points.
3. Develop a Trading Plan: your strategy, including entry and exit rules, risk management, and how much capital you’ll invest per trade.
4. Practice with Paper Trading: Use a demo account to practice your strategy without risking real money. Focus on executing trades based on your technical analysis.
5. Analyze Charts: Study price charts to spot patterns and trends. Look for support and resistance levels to determine potential trade setups.
6. Set Risk Management Rules: Define your risk tolerance. Use stop-loss orders to protect your capital and set profit targets to lock in gains.
7. Stay Updated: Keep an eye on market news and economic indicators that could impact stock prices.
8. Review and Adjust: After trades, analyze what worked and what didn’t. Adjust your strategy based on your findings.
By following these steps, you can effectively start day trading using technical analysis.
What key indicators should I use in my day trading strategy?
Use the following key indicators in your day trading strategy:
1. Moving Averages: Identify trends with the 50-day and 200-day moving averages.
2. Relative Strength Index (RSI): Gauge momentum; look for overbought (above 70) or oversold (below 30) conditions.
3. Bollinger Bands: Assess volatility; price touching the upper band may indicate a sell, while the lower band suggests a buy.
4. Volume: Confirm trends; rising volume can validate price movements.
5. MACD (Moving Average Convergence Divergence): Spot potential buy/sell signals through crossovers and divergence.
Incorporate these indicators to enhance your decision-making and improve your chances of success.
How can I identify trends for day trading?
To identify trends for day trading, focus on these key strategies:
1. Use Moving Averages: Analyze short-term and long-term moving averages. A crossover can signal a trend change.
2. Check Trend Lines: Draw trend lines on price charts. An upward trend line indicates buying opportunities, while a downward line suggests selling.
3. Look at Volume: Observe volume trends alongside price movements. Increasing volume confirms a stronger trend.
4. Utilize Technical Indicators: Apply indicators like the Relative Strength Index (RSI) or MACD to identify overbought or oversold conditions.
5. Candlestick Patterns: Study candlestick formations for indications of trend reversals or continuations.
6. News and Events: Monitor financial news and economic events that can impact market sentiment and trigger trends.
7. Timeframes: Analyze multiple timeframes. A trend on a higher timeframe can provide context for day trading decisions.
By combining these techniques, you can effectively identify and capitalize on trends in day trading.
What are the best chart patterns for day trading?
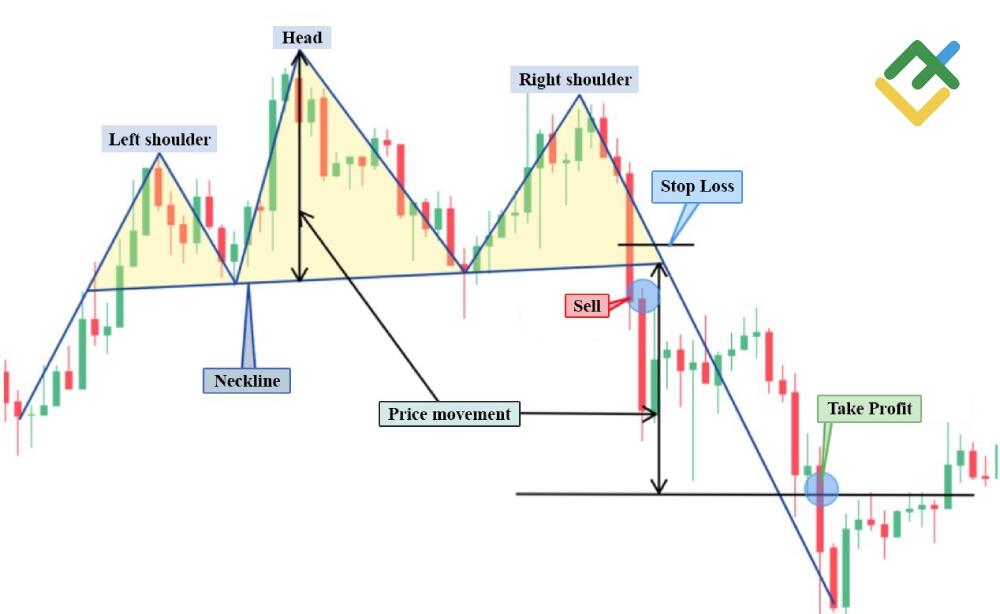
The best chart patterns for day trading include:
1. Head and Shoulders: Indicates a reversal, signaling a potential price drop after an uptrend.
2. Double Top and Bottom: Shows potential reversal points; a double top suggests a bearish reversal, while a double bottom indicates bullish potential.
3. Flags and Pennants: Continuation patterns that follow strong price movements, suggesting a brief pause before the trend resumes.
4. Triangles: Ascending, descending, and symmetrical triangles indicate consolidation and potential breakout directions.
5. Cup and Handle: A bullish pattern that signals a breakout after a consolidation phase.
Utilizing these patterns can enhance your day trading strategy based on technical analysis.
How do I set entry and exit points in day trading?
To set entry and exit points in day trading, use technical analysis:
1. Identify Support and Resistance Levels: Look for price levels where the stock has historically reversed. These are key for setting entry and exit points.
2. Use Indicators: Incorporate tools like moving averages, RSI, or MACD to confirm trends and potential reversals. For example, if the RSI is below 30, it might indicate a buying opportunity.
3. Candlestick Patterns: Watch for patterns like pin bars or engulfing candles at support levels for entry signals.
4. Set Entry Points: Enter trades near support for buys or resistance for sells, confirmed by your indicators or patterns.
5. Determine Exit Points: Set profit targets at resistance levels for long positions and support levels for shorts. Use trailing stops to lock in profits as the price moves in your favor.
6. Risk Management: Always define stop-loss levels based on volatility or a percentage of your trading capital to limit losses.
By combining these strategies, you can effectively establish your entry and exit points in day trading.
What role do moving averages play in day trading?
Moving averages smooth out price data to identify trends in day trading. They help traders determine entry and exit points by signaling potential support and resistance levels. Short-term moving averages, like the 10-day or 20-day, react quickly to price changes, making them useful for spotting trends. Longer moving averages, such as the 50-day or 200-day, provide context on the overall market direction. Crossovers between different moving averages can indicate buy or sell signals. Overall, they simplify price action, allowing day traders to make informed decisions quickly.
How can I manage risk in my day trading strategy?
To manage risk in your day trading strategy, start by defining your risk tolerance per trade, ideally limiting it to 1-2% of your trading capital. Use stop-loss orders to automatically exit losing trades at predetermined levels. Position sizing is crucial; calculate the number of shares to buy based on your risk per trade and the distance to your stop-loss. Diversify your trades across different assets to reduce exposure. Regularly review your trades to learn from mistakes and adjust your strategy accordingly. Lastly, keep emotions in check; stick to your plan and avoid impulsive decisions.
What is the importance of volume in technical analysis for day trading?
Volume is crucial in technical analysis for day trading because it indicates the strength of price movements. High volume confirms trends, showing that many traders support the direction of the price. Low volume can signal weak moves or potential reversals. Day traders use volume to identify entry and exit points, ensuring they trade when there’s sufficient interest. Additionally, volume helps in spotting breakouts, as significant increases often precede major price shifts. Understanding volume dynamics enhances decision-making and risk management in day trading.
How do I use support and resistance levels in day trading?
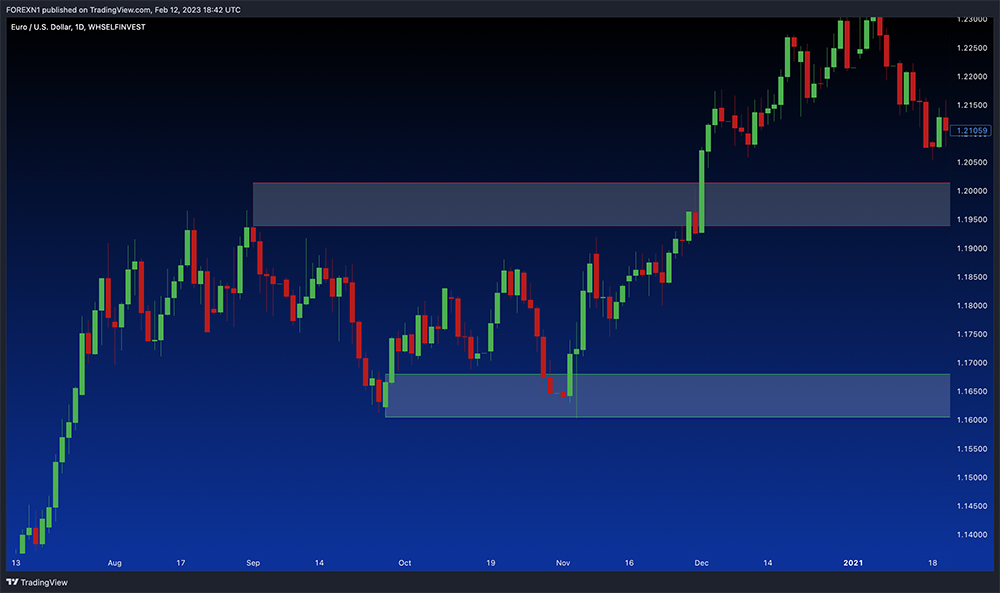
To use support and resistance levels in day trading, first identify these key levels on your charts. Support is where the price tends to stop falling, while resistance is where it tends to stop rising.
1. Identify Levels: Use historical price data to find areas where the price has previously reversed. Look for horizontal lines or trend lines.
2. Watch for Breakouts: If the price breaks through resistance, it may continue rising; if it breaks support, it may continue falling. Consider entering trades on these breakouts.
3. Set Entry and Exit Points: Use support as a potential entry point for buying and resistance as a target for selling.
4. Use Stop Losses: Place stop-loss orders just below support or above resistance to manage risk.
5. Combine with Other Indicators: Enhance your strategy by integrating other tools like moving averages or RSI for confirmation.
By applying these steps, you can effectively incorporate support and resistance levels into your day trading strategy.
Learn about How Do Institutional Traders Use Leverage in Day Trading?
What are the common mistakes to avoid in day trading?
1. Ignoring Risk Management: Never risk more than 1-2% of your capital on a single trade.
2. Overtrading: Avoid entering too many positions; focus on quality setups instead.
3. Lack of a Trading Plan: Always have a clear strategy that outlines entry and exit points.
4. Emotional Trading: Don’t let fear or greed dictate your decisions; stick to your plan.
5. Neglecting Technical Analysis: Rely on charts and indicators; don’t make trades based solely on news.
6. Inadequate Preparation: Research and analyze before trading; know your stocks and market conditions.
7. Failure to Adapt: Be flexible; adjust your strategy based on market changes.
8. Chasing Losses: Don’t double down on losing trades; accept losses and move on.
Learn about What Are Common Mistakes in Institutional Day Trading?
How can I backtest my day trading strategy effectively?
To effectively backtest your day trading strategy based on technical analysis, follow these steps:
1. Define Your Strategy: Clearly your entry and exit criteria, risk management rules, and any indicators you’ll use.
2. Select a Backtesting Platform: Use software like TradingView, MetaTrader, or specialized backtesting tools that allow you to input your strategy.
3. Gather Historical Data: Obtain accurate historical price data for the assets you plan to trade. Ensure it includes various market conditions.
4. Run Simulations: Apply your strategy to the historical data, simulating trades based on your defined criteria.
5. Analyze Results: Evaluate key metrics like win rate, average profit/loss, drawdown, and total returns to gauge performance.
6. Refine Your Strategy: Adjust your strategy based on the backtesting results. Optimize indicators, timeframes, and risk management techniques.
7. Forward Test: Once refined, implement the strategy in a demo account to see how it performs in real-time conditions.
By following these steps, you can effectively backtest your day trading strategy and improve your chances of success.
Learn about How to Backtest Day Trading Bots Effectively?
What are the psychological factors influencing day trading success?
Psychological factors influencing day trading success include emotional discipline, risk tolerance, and decision-making under pressure. Traders must manage fear and greed to avoid impulsive decisions. Confidence plays a role; overconfidence can lead to excessive risk-taking, while lack of it can result in missed opportunities. Additionally, maintaining a clear strategy and sticking to it helps mitigate stress and emotional swings, essential for consistent performance in day trading.
How Can Beginners Use Technical Analysis to Create Effective Day Trading Strategies?
To craft a day trading strategy based on technical analysis, start by identifying key technical indicators like moving averages, RSI, and MACD. Set clear entry and exit points based on these indicators, and use chart patterns to confirm trends. Establish risk management rules, such as stop-loss orders, to protect your capital. Finally, backtest your strategy using historical data to refine it before applying it in real-time trading.
Learn more about: Day Trading Strategies for Beginners
Learn about How to Use Technical Analysis for Day Trading ETFs
How do news events impact day trading strategies?
News events significantly impact day trading strategies by creating volatility and influencing price movements. Traders often adjust their technical analysis based on anticipated news releases, such as earnings reports or economic indicators. For example, if positive earnings are expected, traders may look for bullish signals in their charts. Conversely, negative news can trigger sell-offs, prompting traders to identify bearish patterns.
Incorporating news into technical analysis means being aware of scheduled releases and adjusting stop-loss levels or profit targets accordingly. Traders often utilize indicators like volume spikes or candlestick patterns to gauge market reactions to news, enhancing their entry and exit points. This combination of technical analysis and news awareness can lead to more informed trading decisions and improved outcomes.
Learn about How News Events Impact Day Trading Decisions
What tools and software can assist in technical analysis for day trading?

Key tools and software for technical analysis in day trading include:
1. Charting Software: Platforms like TradingView and MetaTrader offer advanced charting capabilities with various indicators.
2. Technical Indicators: Use tools like Moving Averages, RSI, MACD, and Bollinger Bands to analyze price trends.
3. Stock Scanners: Software like Trade Ideas or Finviz helps identify potential trading opportunities based on technical signals.
4. Backtesting Tools: Use ThinkOrSwim or Amibroker to test your strategies against historical data.
5. News Aggregators: Services like Benzinga Pro provide real-time news that can impact stock prices.
6. Brokerage Platforms: Most brokers, like E*TRADE or TD Ameritrade, offer built-in technical analysis tools and resources.
Choose a combination that fits your trading style for optimal results.
Learn about Day Trading Software for Technical Analysis
How can I evaluate the performance of my day trading strategy?
To evaluate your day trading strategy based on technical analysis, follow these steps:
1. Backtesting: Apply your strategy to historical data to see how it would have performed. Look for win/loss ratios, average profit per trade, and drawdowns.
2. Performance Metrics: Analyze key metrics such as the Sharpe ratio, maximum drawdown, and return on investment (ROI). These will give you insights into risk vs. reward.
3. Consistency: Measure how consistently your strategy performs over different market conditions and time frames.
4. Trade Journaling: Keep a detailed journal of trades, noting entry/exit points, reasons for trades, and outcomes. Review this regularly to identify patterns.
5. Risk Management: Assess how well your strategy manages risk. Calculate your risk-reward ratio and ensure it aligns with your trading goals.
6. Adaptation: Continuously refine your strategy based on performance data. Stay flexible and adjust to market changes.
By systematically evaluating these elements, you can effectively measure and improve your day trading strategy.
Learn about How Do Prop Firms Evaluate Day Trading Performance?
Conclusion about Crafting a Day Trading Strategy Based on Technical Analysis
In summary, a well-crafted day trading strategy based on technical analysis is crucial for navigating the complexities of the market. By understanding key indicators, identifying trends, and managing risk, traders can enhance their decision-making process. Utilizing tools for backtesting and remaining aware of psychological factors further strengthens your approach. For those eager to deepen their knowledge and refine their strategies, DayTradingBusiness offers valuable insights and resources to support your trading journey.
Learn about Day Trading Software for Technical Analysis