Did you know that even the best traders sometimes mistake a breakdance for a breakout? In the world of trading, understanding breakout strategies is crucial for capitalizing on price movements. This article delves into the essentials of combining breakout strategies with technical analysis, guiding you through key concepts like identifying breakouts, recognizing false signals, and leveraging chart patterns. You'll discover the importance of volume trends, support and resistance, and how market sentiment influences your trading decisions. Additionally, we’ll cover stop-loss orders, risk management, and common pitfalls to avoid. With insights from DayTradingBusiness, you’ll learn best practices to develop a solid breakout trading plan that can be applied across various asset classes. Get ready to elevate your trading game!
What are breakout strategies in trading?
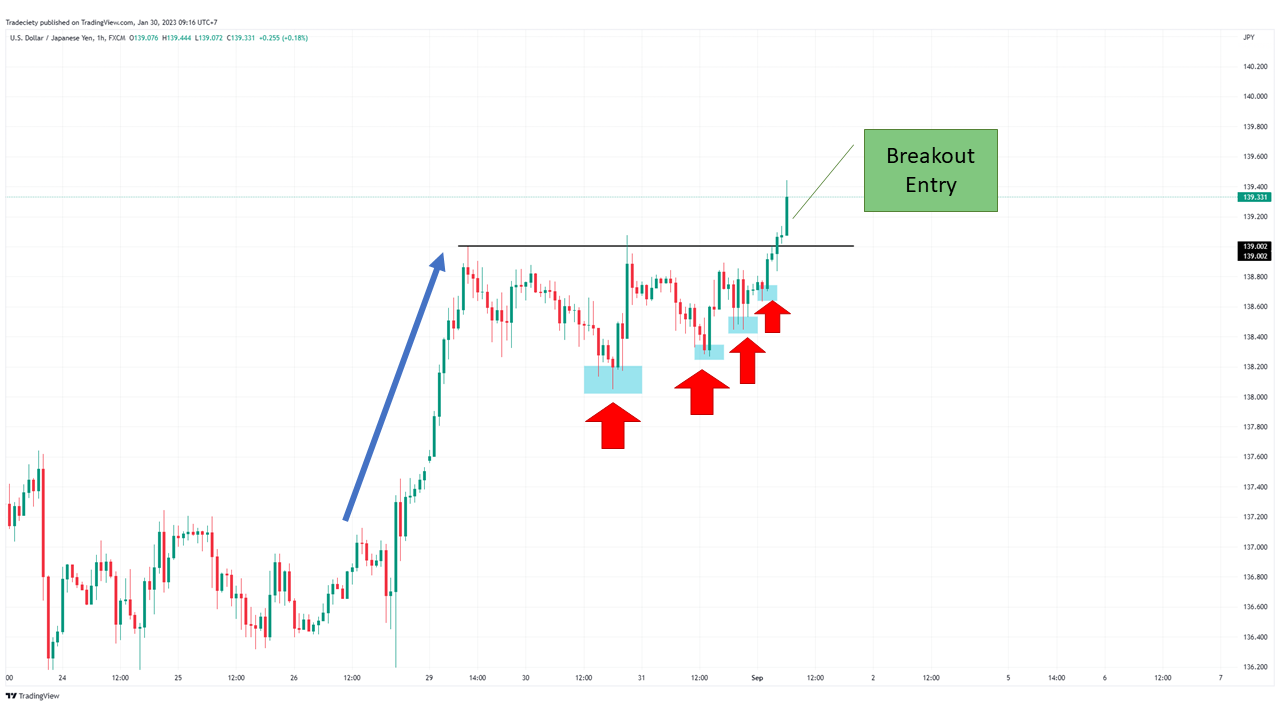
Breakout strategies in trading involve entering a position when the price moves beyond a defined support or resistance level, signaling a potential trend continuation. Traders use technical analysis tools like trendlines, moving averages, and volume indicators to identify these levels. Common breakout strategies include:
1. Price Action Breakouts: Entering trades based on the price closing above resistance or below support.
2. Volume Confirmation: Looking for increased volume during breakouts to validate the strength of the move.
3. Pullback Entries: Waiting for a price retracement to the breakout level before entering, which often provides a better risk-reward ratio.
Combining these strategies with technical analysis enhances decision-making, helping traders capitalize on market momentum.
How does technical analysis support breakout strategies?
Technical analysis supports breakout strategies by identifying key price levels, trends, and momentum indicators. Traders use chart patterns like triangles or flags to spot potential breakouts. Volume analysis confirms the strength of a breakout; higher volume often indicates a valid move. Tools like moving averages and RSI help assess market conditions, signaling when to enter a trade. By combining these elements, traders can increase their chances of successfully capitalizing on price movements after a breakout.
What indicators help identify breakouts?
Key indicators to identify breakouts include:
1. Volume: A significant increase in trading volume often signals a breakout.
2. Price Patterns: Look for formations like triangles, flags, or head and shoulders that indicate potential breakouts.
3. Moving Averages: A price crossing above or below a moving average can indicate a breakout.
4. Relative Strength Index (RSI): An RSI above 70 may suggest overbought conditions, while below 30 may indicate oversold, signaling possible breakouts.
5. Bollinger Bands: A price move outside the bands can indicate a breakout direction.
6. Support and Resistance Levels: Breaking through established support or resistance levels often leads to strong price movements.
Combine these indicators for a more reliable breakout strategy.
How can I spot a false breakout?
To spot a false breakout, look for the following signs:
1. Volume Analysis: A breakout accompanied by low volume may indicate weakness. True breakouts usually have higher volume.
2. Price Reversal: If the price quickly returns to the previous range after breaking out, it’s likely a false breakout.
3. Candlestick Patterns: Watch for reversal candlesticks (like pin bars) forming near breakout levels.
4. Support and Resistance Levels: If the breakout doesn’t hold above key support or resistance levels, it may be false.
5. Timeframe Confirmation: Check multiple timeframes. A breakout on a lower timeframe may not hold on a higher timeframe.
6. Indicators Divergence: If momentum indicators like RSI or MACD show divergence while prices break out, it could signal a false move.
By combining these strategies with your technical analysis, you can better identify false breakouts.
What is the best time frame for breakout trading?
The best time frame for breakout trading typically ranges from 15 minutes to 1 hour for day trading, and from daily to weekly charts for swing trading. Shorter time frames allow for quick entries and exits, while longer time frames help capture bigger moves and reduce noise. Choose based on your trading style and risk tolerance.
How do volume trends affect breakout strategies?
Volume trends are crucial for breakout strategies because they confirm the strength of a price movement. High volume during a breakout signals strong buyer or seller interest, indicating that the price is likely to continue in that direction. Conversely, low volume can suggest a lack of conviction, making the breakout more prone to failure.
For effective breakout strategies, look for increases in volume at key resistance or support levels. This combination enhances the reliability of the breakout and helps avoid false signals. Always analyze volume alongside price action for a clearer picture of market sentiment.
What chart patterns are essential for breakouts?
Essential chart patterns for breakouts include:
1. Triangles: Symmetrical, ascending, and descending triangles often indicate a price breakout when the price moves beyond the trendlines.
2. Flags and Pennants: These short-term continuation patterns signal potential breakouts after a brief consolidation period.
3. Head and Shoulders: This reversal pattern can signal a breakout when the price moves below the neckline.
4. Double Tops and Bottoms: These patterns indicate potential reversals and can lead to significant breakouts when confirmed.
5. Cup and Handle: This bullish pattern suggests a breakout when the price rises above the resistance level.
6. Channels: Breakouts can occur when the price moves outside the upper or lower channel lines.
Recognizing these patterns can enhance your breakout strategies in technical analysis.
How can I use support and resistance in breakouts?
To use support and resistance in breakouts, first identify key support and resistance levels on your chart. When the price approaches a resistance level, look for signs of a breakout, such as increased volume or bullish candlestick patterns. If the price breaks above resistance, it may indicate a continuation upward, suggesting a buying opportunity.
Conversely, if the price nears a support level and shows signs of a breakdown, such as bearish volume spikes, it could signal a selling opportunity. Always set a stop-loss just below support or above resistance to manage risk. Combining these strategies with technical indicators like moving averages can enhance your breakout analysis.
How Can I Combine Breakout Strategies with Technical Analysis for Day Trading?
Day trading breakout strategies involve identifying key price levels where a stock is likely to make a significant move. Combining these strategies with technical analysis means using indicators like volume, moving averages, and chart patterns to confirm breakouts. Effective techniques include setting entry points above resistance levels, using stop-loss orders to manage risk, and leveraging momentum indicators to validate trade decisions.
Learn more about: What Are Day Trading Breakout Strategies?
What role does market sentiment play in breakout strategies?

Market sentiment significantly influences breakout strategies. When sentiment is bullish, breakouts above resistance levels often attract more buyers, confirming upward momentum. Conversely, negative sentiment can lead to false breakouts, where prices quickly reverse after breaking key support. Traders should assess sentiment through indicators like the VIX or news trends to gauge the strength of a breakout. Combining sentiment analysis with technical indicators enhances the reliability of breakout signals, helping traders make informed decisions.
How do I set stop-loss orders for breakouts?
To set stop-loss orders for breakouts, first identify key support or resistance levels around the breakout point. Place your stop-loss just below the breakout level for long positions or just above for short positions. Use a percentage or dollar amount that aligns with your risk tolerance—typically 1-3% of your trading capital. Additionally, consider using trailing stops to lock in profits as the price moves in your favor. Adjust your stop-loss if the price consolidates above the breakout level, ensuring you protect gains while allowing for potential further movement.
Learn about How to set effective stop-loss orders to limit risk
What are the benefits of combining breakout strategies with technical analysis?
Combining breakout strategies with technical analysis offers several benefits. First, it helps traders identify key levels of support and resistance, increasing the likelihood of successful breakouts. Second, technical indicators like volume and momentum can confirm breakout signals, reducing false entries. Third, this combination allows for more precise entry and exit points, enhancing risk management. Lastly, it improves overall market understanding, enabling traders to anticipate price movements more effectively.
How can I manage risk when trading breakouts?
To manage risk when trading breakouts, set clear entry and exit points based on technical analysis. Use stop-loss orders just below breakout levels to limit potential losses. Position size according to your risk tolerance, ensuring you don't risk more than 1-2% of your trading capital on a single trade. Monitor volume; a strong breakout should be accompanied by high trading volume to confirm the move. Additionally, consider using trailing stops to lock in profits as the trade moves in your favor. Always stay informed about market conditions that could affect the breakout.
Learn about How to manage leverage risk when day trading?
What are common mistakes in breakout trading?
Common mistakes in breakout trading include:
1. Entering too early: Traders often jump in before a confirmed breakout, leading to false signals.
2. Ignoring volume: A breakout without sufficient volume can indicate weakness; always check volume levels.
3. Setting tight stop losses: This can result in getting stopped out during normal volatility.
4. Failing to adjust for market conditions: Not considering overall market trends can lead to poor timing.
5. Overtrading: Chasing multiple breakouts can dilute focus and increase risk.
6. Neglecting risk management: Not defining risk parameters can lead to significant losses.
7. Ignoring support and resistance: Breakouts can fail if they encounter strong support or resistance levels.
8. Lack of a clear exit strategy: Not having predetermined profit targets can result in missed opportunities.
Focus on these pitfalls to enhance your breakout trading strategy.
Can breakout strategies be applied to different asset classes?

Yes, breakout strategies can be applied to different asset classes like stocks, forex, commodities, and cryptocurrencies. Each asset class may require specific adjustments in terms of volatility and market behavior, but the core principle of identifying price levels for potential breakout trades remains the same. For example, in stocks, you might focus on resistance levels, while in forex, you could look at currency pair trends. Technical analysis tools, such as moving averages or Bollinger Bands, can enhance breakout strategies across these asset classes.
How do I develop a breakout trading plan?
To develop a breakout trading plan, start by identifying key support and resistance levels on your charts. Use technical analysis tools like trend lines and moving averages to spot potential breakouts. Define your entry point, ideally just above resistance for bullish trades or below support for bearish trades. Set clear stop-loss levels to manage risk, typically a few pips below the breakout point for long trades or above for short trades. Determine your profit target based on risk-reward ratios, aiming for at least 2:1. Lastly, backtest your strategy and adjust based on your findings to refine your approach.
What are the best practices for executing breakout trades?
To execute breakout trades effectively, follow these best practices:
1. Identify key levels: Look for resistance and support levels where price has previously struggled to break through.
2. Use volume analysis: Ensure breakouts occur on high volume, confirming strength and reducing the chance of false breakouts.
3. Set entry orders: Place buy orders slightly above resistance or sell orders below support to catch the breakout as it happens.
4. Manage risk: Use stop-loss orders to protect against reversals, ideally just below the breakout point for buys or above for sells.
5. Confirm with indicators: Utilize technical indicators like moving averages or RSI to validate the breakout's strength.
6. Monitor market conditions: Stay aware of overall market trends and news that might impact price movements.
7. Be patient: Wait for a clear breakout rather than jumping in at the first sign of movement.
8. Scale out profits: Consider taking partial profits at predetermined levels to lock in gains while letting some positions run.
Implement these strategies to enhance your breakout trading success.
Conclusion about Combining Breakout Strategies with Technical Analysis
Incorporating breakout strategies with technical analysis enhances your trading effectiveness by providing clear entry and exit signals. Utilizing indicators, recognizing chart patterns, and understanding market sentiment are crucial for successful trades. By managing risks and avoiding common pitfalls, you can optimize your results. Remember to continuously refine your trading plan to stay aligned with market dynamics and trends. For more insights and guidance, DayTradingBusiness offers valuable resources to help you navigate the complexities of breakout trading.
Learn about Combining Technical Analysis with Reversal Strategies