Did you know that even the best day trading algorithms can have a bad hair day? In the world of algorithmic trading, understanding key metrics is crucial for success. This article delves into the essential metrics for evaluating day trading algorithms, including performance measurement techniques, the significance of the Sharpe Ratio, and the impact of drawdown metrics. We’ll explore the importance of win rates, risk-reward ratios, and the role of backtesting in algorithm evaluation. Additionally, we’ll discuss how trading volume, slippage, and commission costs can influence performance, as well as the meaning of alpha and beta. By understanding volatility, setting benchmarks, and interpreting the Sortino Ratio, traders can gain insights into algorithm adaptability. Lastly, we’ll highlight how simulation data can enhance your evaluation process. With insights from DayTradingBusiness, you’ll be equipped to refine your trading strategies effectively.
What are the essential metrics for evaluating day trading algorithms?
The essential metrics for evaluating day trading algorithms include:
1. Sharpe Ratio: Measures risk-adjusted return; higher is better.
2. Maximum Drawdown: Indicates the largest peak-to-trough loss; lower is preferable.
3. Win Rate: Percentage of profitable trades; higher rates signal effectiveness.
4. Profit Factor: Ratio of gross profit to gross loss; values over 1.5 are generally good.
5. Average Trade Duration: Helps assess holding periods; optimal durations vary by strategy.
6. Return on Investment (ROI): Measures profit relative to capital; higher ROI indicates better performance.
7. Volatility: Examines price fluctuations; lower volatility can imply a more stable algorithm.
These metrics provide a comprehensive view of performance and risk for day trading algorithms.
How do you measure a day trading algorithm's performance?
To measure a day trading algorithm's performance, focus on these key metrics:
1. Return on Investment (ROI): Calculate the percentage return generated relative to the initial investment.
2. Sharpe Ratio: Assess risk-adjusted returns by comparing the algorithm's excess return to its volatility.
3. Win Rate: Determine the percentage of profitable trades out of total trades taken.
4. Average Gain vs. Average Loss: Analyze the average profit from winning trades against the average loss from losing trades.
5. Maximum Drawdown: Measure the largest peak-to-trough decline in portfolio value to evaluate risk.
6. Trade Frequency: Track the number of trades executed within a specific timeframe to understand activity levels.
7. Profit Factor: Calculate the ratio of gross profit to gross loss to gauge overall profitability.
8. Slippage and Transaction Costs: Account for the impact of market conditions and fees on realized profits.
These metrics provide a comprehensive view of a day trading algorithm's effectiveness and risk profile.
What is the significance of the Sharpe Ratio in trading algorithms?
The Sharpe Ratio measures the risk-adjusted return of a trading algorithm. A higher Sharpe Ratio indicates that the algorithm generates more return per unit of risk taken. This metric helps traders compare different strategies effectively, highlighting which algorithms deliver better performance relative to their volatility. It’s crucial for assessing the consistency of returns and identifying the most efficient trading systems. In essence, a strong Sharpe Ratio signifies a more favorable balance of risk and reward.
How can drawdown metrics impact algorithm evaluation?
Drawdown metrics measure the decline from a historical peak in trading capital, reflecting risk and volatility. High drawdowns indicate potential risks, which can deter investors. In algorithm evaluation, understanding drawdown helps assess an algorithm's resilience to market fluctuations. Algorithms with lower maximum drawdowns are often preferred as they suggest more stable performance. Additionally, drawdown duration can reveal recovery time, influencing the strategy's attractiveness. Overall, drawdown metrics are crucial in determining the risk-reward balance of day trading algorithms.
What role does win rate play in day trading algorithm effectiveness?
Win rate measures the percentage of profitable trades in a day trading algorithm. A higher win rate indicates better effectiveness, as it suggests the algorithm successfully identifies winning opportunities. However, it must be considered alongside other metrics like risk-reward ratio and overall profitability. An algorithm with a high win rate but low returns per trade may not perform well. Balancing win rate with other key metrics provides a clearer picture of the algorithm's effectiveness in day trading.
How do you assess risk-reward ratios in trading strategies?
To assess risk-reward ratios in trading strategies, calculate the expected return against the potential loss. Use the formula: Risk-Reward Ratio = (Potential Profit) / (Potential Loss). A ratio above 1 indicates more reward than risk. Analyze metrics like win rate and average gain versus average loss to refine your strategy. Backtest your algorithm across different market conditions to validate its effectiveness. Adjust your entry and exit points based on historical performance to optimize the ratio.
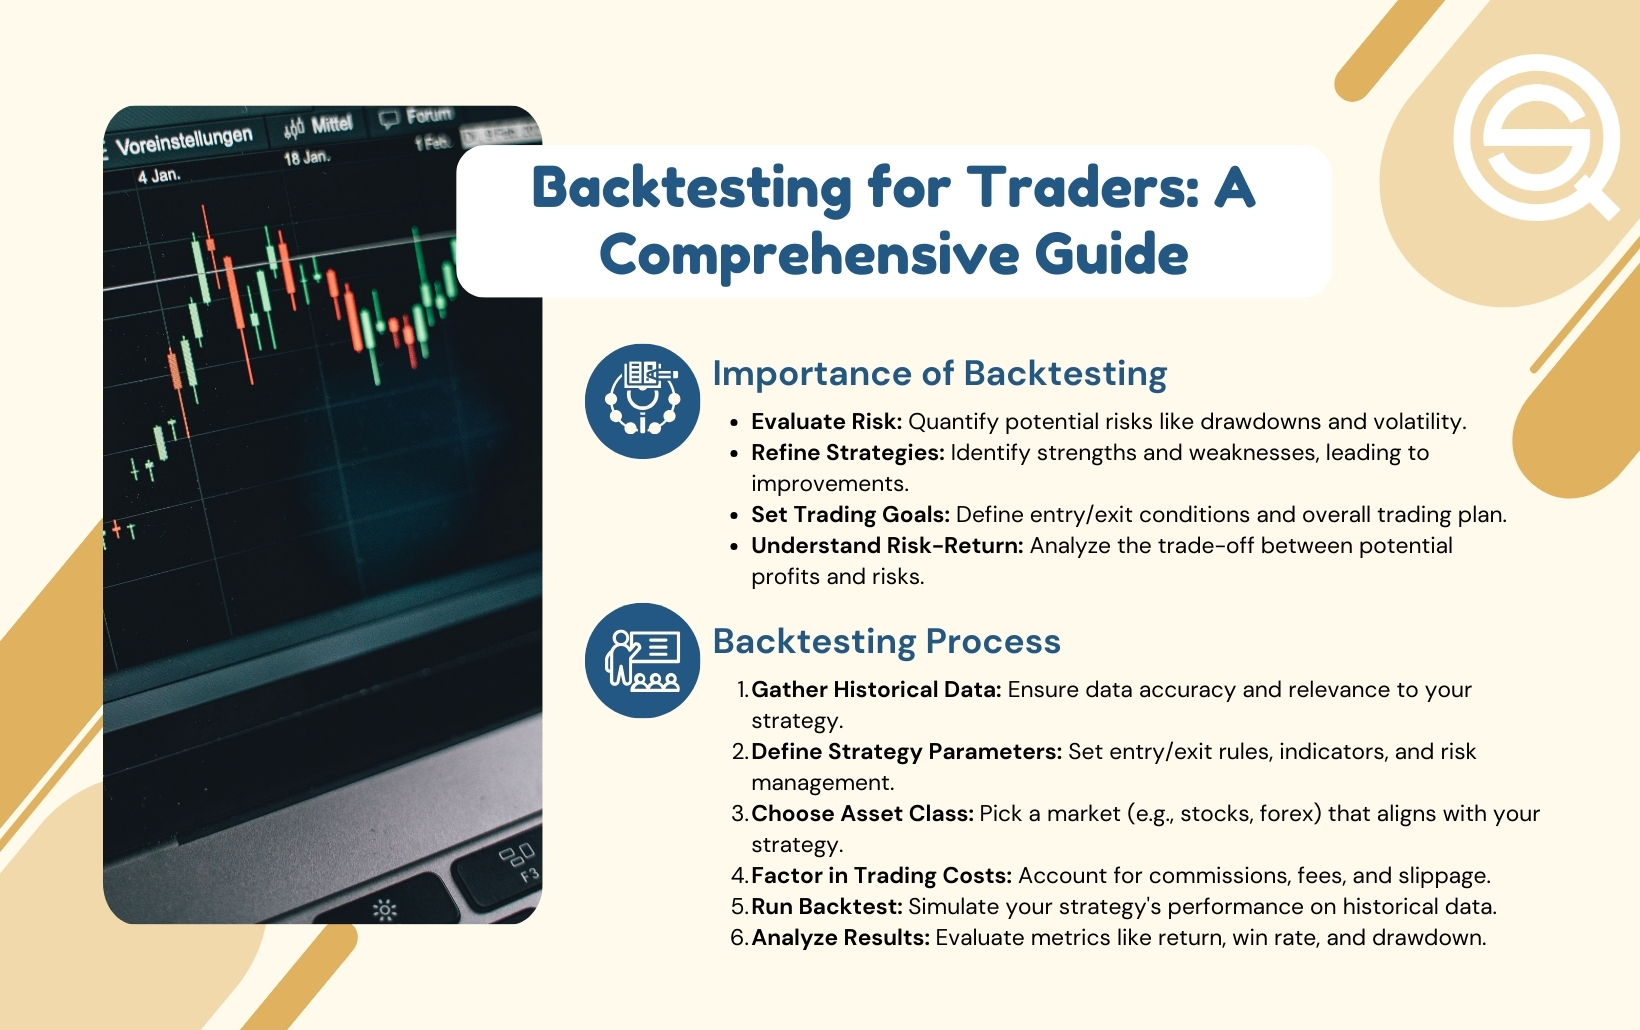
What is the importance of backtesting in evaluating trading algorithms?
Backtesting is crucial in evaluating trading algorithms because it allows traders to simulate the algorithm's performance using historical data. This process reveals how the strategy would have performed in different market conditions, helping identify potential profitability and risk levels. Key metrics assessed during backtesting include the Sharpe ratio, maximum drawdown, win rate, and profit factor. These metrics provide insights into risk-adjusted returns, potential losses, and overall effectiveness, enabling traders to refine their strategies before deploying real capital.
How can trading volume affect algorithm performance metrics?

Trading volume can significantly impact algorithm performance metrics by influencing liquidity, slippage, and volatility. Higher trading volume typically leads to better liquidity, allowing algorithms to execute trades at desired prices without large price shifts. Conversely, low volume can increase slippage, where the execution price differs from the expected price, negatively affecting returns. Additionally, trading volume can indicate market sentiment; algorithms may perform better during high-volume periods due to clearer trends. Monitoring volume alongside metrics like Sharpe ratio and drawdown is essential for evaluating algorithm effectiveness.
What metrics help in understanding algorithm consistency over time?
To understand algorithm consistency over time in day trading, focus on these key metrics:
1. Sharpe Ratio: Measures risk-adjusted returns, indicating how well the algorithm performs relative to risk taken.
2. Max Drawdown: Shows the largest peak-to-trough decline, helping assess potential risk exposure.
3. Win Rate: The percentage of profitable trades versus total trades, indicating overall effectiveness.
4. Average Trade Return: Calculates the average profit or loss per trade, providing insight into performance consistency.
5. Profit Factor: The ratio of gross profits to gross losses, highlighting the algorithm's ability to generate profits relative to losses.
6. Volatility: Assesses the price fluctuations of trades, indicating stability over time.
7. Alpha: Measures the excess return compared to a benchmark, revealing the algorithm’s unique performance.
Monitoring these metrics consistently will give a clear picture of your algorithm's reliability and performance trends.
How do slippage and commission costs influence algorithm evaluation?
Slippage and commission costs significantly impact algorithm evaluation by directly affecting profitability. Slippage, the difference between expected and actual trade prices, can erode gains, especially in high-frequency trading. Commission costs reduce overall returns, making it crucial to factor them into performance metrics. Algorithms performing well in backtesting might underperform in real markets due to these costs, skewing results. Evaluating an algorithm's effectiveness requires accounting for both slippage and commissions to assess true profitability and risk.
What is the meaning of alpha and beta in trading algorithms?
In trading algorithms, "alpha" measures the excess return of an investment compared to a benchmark, indicating how well the algorithm performs relative to the market. "Beta," on the other hand, quantifies the algorithm's volatility in relation to the market; a beta greater than 1 means higher volatility than the market, while less than 1 indicates lower volatility. These metrics help evaluate the risk and return profile of day trading algorithms.
How can you analyze the volatility of a day trading algorithm?
To analyze the volatility of a day trading algorithm, focus on these key metrics:
1. Standard Deviation: Measure the dispersion of returns. A higher standard deviation indicates greater volatility.
2. Beta: Assess the algorithm’s sensitivity to market movements. A beta above 1 means higher volatility compared to the market.
3. Maximum Drawdown: Identify the largest peak-to-trough decline. This shows potential risks during volatile periods.
4. Sharpe Ratio: Evaluate risk-adjusted returns. A low Sharpe ratio can indicate high volatility relative to returns.
5. Win Rate: Analyze the percentage of profitable trades. A low win rate with high volatility may signal an unreliable algorithm.
6. Average Trade Duration: Shorter trade durations can indicate higher volatility in price movements.
7. Volume Analysis: Monitor trading volume spikes, which often accompany volatile price changes.
Use these metrics to get a clear picture of your algorithm's volatility and adjust strategies accordingly.
Learn about How to Analyze Historical Data Using Day Trading Charts
What are the best practices for setting benchmarks for trading performance?
The best practices for setting benchmarks for trading performance include:
1. Define Clear Objectives: Identify specific goals such as return on investment (ROI), risk tolerance, and trading frequency.
2. Use Relevant Indices: Compare performance against relevant market indices or benchmarks that reflect the trading strategy’s focus.
3. Incorporate Risk-Adjusted Metrics: Utilize metrics like Sharpe ratio, Sortino ratio, and maximum drawdown to evaluate performance relative to risk.
4. Set Timeframes: Establish benchmarks over consistent timeframes (e.g., daily, weekly, monthly) to accurately gauge performance trends.
5. Track Consistency: Measure consistency in performance, focusing on win rates and average gain versus average loss.
6. Review and Adjust: Regularly review benchmarks and adjust them based on market conditions and strategy changes.
7. Incorporate Transaction Costs: Include costs such as commissions and slippage to ensure realistic performance evaluations.
How do you interpret the Sortino Ratio for trading algorithms?
The Sortino Ratio measures a trading algorithm's performance relative to downside risk. A higher Sortino Ratio indicates better risk-adjusted returns, meaning the algorithm generates more profit for each unit of downside volatility. A ratio above 1 is generally considered good, while above 2 is excellent. Use it to compare different algorithms; the one with the higher ratio is typically more favorable in managing risk while achieving returns.
What metrics indicate an algorithm's adaptability to market changes?

Key metrics to evaluate a day trading algorithm's adaptability to market changes include:
1. Sharpe Ratio: Measures risk-adjusted returns, indicating how well the algorithm performs under varying market conditions.
2. Maximum Drawdown: Reflects the largest drop from a peak, showing how the algorithm handles downturns.
3. Win Rate: The percentage of profitable trades can indicate consistency in changing markets.
4. Profit Factor: The ratio of gross profit to gross loss, highlighting the algorithm's ability to capitalize on favorable conditions.
5. Recovery Factor: Compares annual return to maximum drawdown, assessing how quickly the algorithm can recover from losses.
6. Volatility: Measures the algorithm’s performance variability, which can indicate adaptability to sudden market shifts.
7. Alpha: Represents the excess return over a benchmark, revealing how well the algorithm can adapt and outperform the market.
Tracking these metrics helps determine how well an algorithm can adjust to market changes.
How do you use simulation data to evaluate trading algorithms?
To evaluate trading algorithms using simulation data, focus on these key metrics:
1. Sharpe Ratio: Measure risk-adjusted returns. A higher ratio indicates better performance relative to risk.
2. Maximum Drawdown: Assess the largest peak-to-trough decline. Lower drawdowns indicate better risk management.
3. Win Rate: Calculate the percentage of profitable trades. A higher win rate suggests a more effective strategy.
4. Profit Factor: Divide total profits by total losses. A value above 1 indicates a profitable algorithm.
5. Average Trade Return: Evaluate the average profit or loss per trade. Positive averages are essential for success.
6. Trade Duration: Analyze how long trades are held. This helps in understanding the strategy's speed and market responsiveness.
7. Slippage and Transaction Costs: Factor in potential costs to ensure realistic performance evaluation.
Use these metrics to comprehensively assess and refine your day trading algorithms.
Learn about How to Use Market Microstructure Data to Improve Day Trading Outcomes
Conclusion about Key Metrics to Evaluate Day Trading Algorithms
In summary, evaluating day trading algorithms requires a comprehensive understanding of key metrics such as the Sharpe Ratio, win rate, and drawdown. These metrics not only highlight performance but also assess risk and adaptability in changing market conditions. Backtesting and analyzing trading volume further enhance the evaluation process, ensuring a well-rounded approach. By leveraging these insights, traders can make informed decisions that optimize their strategies. For more detailed guidance and support on navigating these metrics, DayTradingBusiness is here to help you succeed in your trading journey.
Learn about Key Metrics to Analyze in Day Trading Backtesting