Did you know that the stock market has a higher chance of making you sweat than a treadmill? In the world of day trading, mastering technical analysis can be your best friend, especially when it comes to ETFs. This article dives into the essentials of technical analysis, from defining what it is and selecting the right ETFs, to the key indicators like moving averages and RSI that can guide your trades. Discover how to identify support and resistance levels, recognize chart patterns, and develop a solid trading plan. We’ll also cover the importance of volume, candlestick patterns, risk management strategies, and the tools you need for effective analysis. Plus, learn how to backtest your strategies and stay updated on market trends. Join DayTradingBusiness as we equip you with the knowledge to navigate the exciting realm of day trading ETFs!
What is Technical Analysis in Day Trading ETFs?
Technical analysis in day trading ETFs involves analyzing price charts and trading volumes to identify patterns and trends. Traders use indicators like moving averages, RSI, and MACD to make buy or sell decisions. Key techniques include support and resistance levels, candlestick patterns, and trend lines. The goal is to predict short-term price movements, enabling quick buying and selling for profit. Effective technical analysis relies on real-time data and often requires discipline and a solid risk management strategy.
How Can I Choose the Right ETFs for Technical Analysis?
To choose the right ETFs for technical analysis in day trading, focus on these key factors:
1. Liquidity: Select ETFs with high trading volume to ensure tight bid-ask spreads, making it easier to enter and exit positions quickly.
2. Volatility: Look for ETFs that exhibit price fluctuations, as this creates opportunities for profit. Check historical volatility metrics to gauge potential price movements.
3. Sector and Industry Trends: Analyze the sectors and industries showing momentum. Use charts to identify strong trends that align with your trading strategy.
4. Chart Patterns: Familiarize yourself with common patterns like flags, triangles, and head-and-shoulders. Choose ETFs that exhibit these patterns for potential breakout opportunities.
5. Indicators: Utilize technical indicators like moving averages, RSI, and MACD to confirm entry and exit points. Select ETFs that respond well to these indicators.
6. News and Events: Stay updated on news affecting the ETFs' underlying assets. Market reactions to news can create trading opportunities based on technical setups.
By focusing on liquidity, volatility, sector trends, chart patterns, indicators, and relevant news, you can effectively select ETFs for day trading using technical analysis.
What Key Indicators Should I Use for Day Trading ETFs?
For day trading ETFs, focus on these key indicators:
1. Moving Averages: Use the 50-day and 200-day moving averages to identify trends and potential reversals.
2. Relative Strength Index (RSI): Look for overbought (above 70) or oversold (below 30) conditions to signal entry or exit points.
3. Volume: Analyze trading volume to confirm price movements; higher volume often indicates stronger price movements.
4. Bollinger Bands: Use them to identify volatility and potential breakout or breakdown points.
5. MACD (Moving Average Convergence Divergence): Monitor for crossovers to spot momentum shifts.
6. Fibonacci Retracement Levels: Identify key support and resistance levels to inform your trades.
Combine these indicators to create a robust trading strategy tailored to ETF movements.
How Do Moving Averages Work in ETF Trading?
Moving averages in ETF trading smooth out price data to identify trends over a specific period. The two main types are the simple moving average (SMA) and the exponential moving average (EMA).
1. SMA calculates the average price over a set number of days, providing a clear view of the overall trend.
2. EMA gives more weight to recent prices, making it more responsive to new information.
Traders use moving averages to determine entry and exit points. For example, a common strategy is to buy when a short-term EMA crosses above a long-term SMA, signaling upward momentum. Conversely, selling occurs when the short-term EMA crosses below the long-term SMA, indicating a potential downturn.
Additionally, moving averages can act as support or resistance levels. If the price approaches a moving average and bounces back, it suggests a strong trend. Using these indicators, traders can make informed decisions in day trading ETFs.
What is the Role of Volume in Technical Analysis for ETFs?
Volume in technical analysis for ETFs indicates the level of trading activity and helps confirm price movements. High volume during a price increase signals strong buying interest, suggesting a potential continuation of the trend. Conversely, high volume on a price drop may indicate strong selling pressure, hinting at possible reversals. For day trading, monitoring volume can help identify entry and exit points, as well as validate chart patterns. Always consider volume alongside other indicators to enhance your trading strategy.
How Can I Identify Support and Resistance Levels in ETFs?
To identify support and resistance levels in ETFs, start by analyzing historical price charts. Look for points where the price has repeatedly bounced off (support) or reversed (resistance). Use trendlines to connect these highs and lows for visual clarity.
Utilize technical indicators like moving averages or the Relative Strength Index (RSI) to confirm these levels. Pay attention to volume spikes at these points, as they often indicate stronger support or resistance.
Lastly, consider key psychological levels, such as round numbers, which can also act as support or resistance. Regularly update your analysis based on new price movements to stay accurate.
What Patterns Should I Look for in ETF Charts?
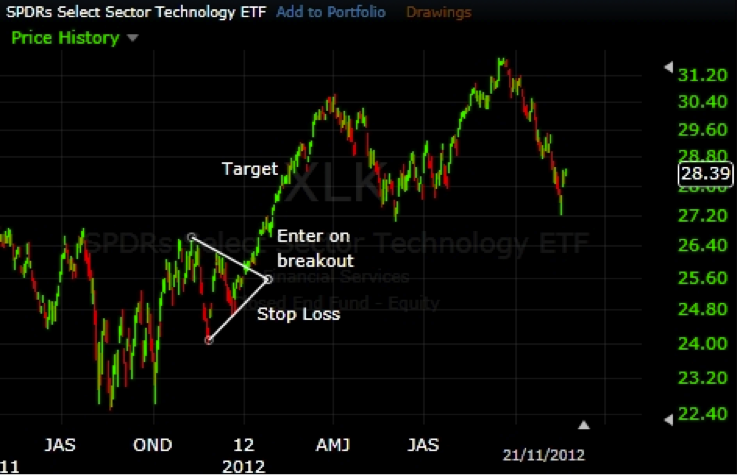
Look for key patterns like flags, triangles, and head-and-shoulders on ETF charts. Identify support and resistance levels to gauge potential price reversals. Watch for moving average crossovers to spot trends. Pay attention to volume spikes, which can indicate strong buying or selling interest. Candlestick formations, such as dojis or engulfing patterns, can signal market sentiment shifts. Lastly, consider the overall market trend to align your trades with broader movements.
How Do I Set Up a Trading Plan Using Technical Analysis?
To set up a trading plan using technical analysis for day trading ETFs, follow these steps:
1. Define Goals: Determine your profit targets and risk tolerance. Decide how much capital you’re willing to allocate.
2. Choose Indicators: Select key technical indicators like moving averages, RSI, or MACD to inform your trades.
3. Identify Trends: Use chart patterns and trend lines to recognize bullish or bearish trends in the ETF you’re trading.
4. Set Entry and Exit Points: Establish specific entry points based on your indicators and set stop-loss orders to manage risk.
5. Create a Timeframe: Decide on the time frame for your trades—whether you’re looking at 1-minute, 5-minute, or hourly charts.
6. Backtest Your Strategy: Review past performance of your indicators and patterns to refine your approach.
7. Monitor and Adjust: Continuously analyze your trades and the market, adjusting your plan as necessary based on performance and changing conditions.
8. Keep a Trading Journal: Document your trades to learn from successes and mistakes, refining your strategy over time.
By following these steps, you'll have a structured trading plan grounded in technical analysis for day trading ETFs.
What Are the Best ETFs for Day Trading Using Technical Analysis?
The best ETFs for day trading typically include those with high liquidity and volatility, such as SPDR S&P 500 ETF (SPY), Invesco QQQ Trust (QQQ), and iShares Russell 2000 ETF (IWM). Use technical analysis by analyzing price charts, identifying trends, and utilizing indicators like moving averages and RSI to make informed trading decisions.
Learn more about: What Are the Best ETFs for Day Trading?
What Time Frames Are Best for Day Trading ETFs?
The best time frames for day trading ETFs are typically 1-minute, 5-minute, and 15-minute charts. The 1-minute chart offers quick entry and exit points, ideal for fast-paced trades. The 5-minute chart balances detail and clarity, making it suitable for spotting short-term trends. The 15-minute chart helps identify broader trends while still allowing for intraday trades. Use these time frames in conjunction with technical analysis tools like moving averages and volume indicators for optimal results.
How Can I Use RSI in Day Trading ETFs?
To use RSI (Relative Strength Index) in day trading ETFs, first, set your RSI period to 14. Look for overbought conditions when RSI exceeds 70 and oversold conditions when it falls below 30. When the RSI is above 70, consider selling or shorting the ETF; when it's below 30, look for buying opportunities.
Combine RSI signals with other indicators for confirmation. For example, if RSI shows oversold while price hits a support level, it strengthens your buying case. Monitor for divergences, where price moves in the opposite direction of RSI, as these can indicate potential reversals. Always set stop-loss orders to manage risk.
Learn about How to Use Market Microstructure Data to Improve Day Trading Outcomes
What is the Importance of Candlestick Patterns in ETF Trading?
Candlestick patterns are crucial in ETF trading as they provide insights into market sentiment and potential price movements. They help traders identify trends, reversals, and entry or exit points. For example, a bullish engulfing pattern suggests a potential price increase, while a bearish harami indicates a possible decline. By analyzing these patterns in conjunction with other technical indicators, traders can make informed decisions and enhance their strategies for day trading ETFs effectively.
How Do I Manage Risk When Day Trading ETFs?
To manage risk when day trading ETFs using technical analysis, follow these steps:
1. Set Stop-Loss Orders: Determine a specific price point to exit a losing trade, minimizing losses.
2. Position Sizing: Only risk a small percentage of your trading capital on each trade, typically 1-2%.
3. Use Technical Indicators: Utilize tools like moving averages, RSI, and MACD to identify entry and exit points.
4. Chart Patterns: Recognize patterns such as flags, triangles, and head and shoulders to predict price movements.
5. Volatility Assessment: Analyze the ETF's historical volatility to adjust your trading strategy and risk tolerance.
6. Keep an Eye on Volume: Ensure there’s sufficient trading volume to confirm trends and support technical signals.
7. Diversify: Avoid concentrating your trades in one sector or asset to spread risk.
8. Stay Informed: Monitor market news and economic indicators that can affect ETF prices.
Implement these strategies to effectively manage risk while day trading ETFs.
Learn about How to manage leverage risk when day trading?
What Tools and Software Can Help with ETF Technical Analysis?
For ETF technical analysis, consider using these tools and software:
1. TradingView: Offers advanced charting tools, technical indicators, and social community insights.
2. MetaTrader 4/5: Popular for customizable indicators and automated trading capabilities.
3. Thinkorswim: Provides comprehensive analysis tools, including real-time data and advanced charting features.
4. StockCharts: Focuses on technical charting with a variety of indicators tailored for ETFs.
5. NinjaTrader: Great for backtesting strategies and analyzing price movements.
6. Yahoo Finance: Good for quick technical overviews and basic charting.
7. Morningstar: While primarily for fundamental analysis, it offers some technical insights on ETF performance.
Using these tools will enhance your ability to make informed decisions in day trading ETFs.
How Can I Backtest My Technical Analysis Strategies for ETFs?
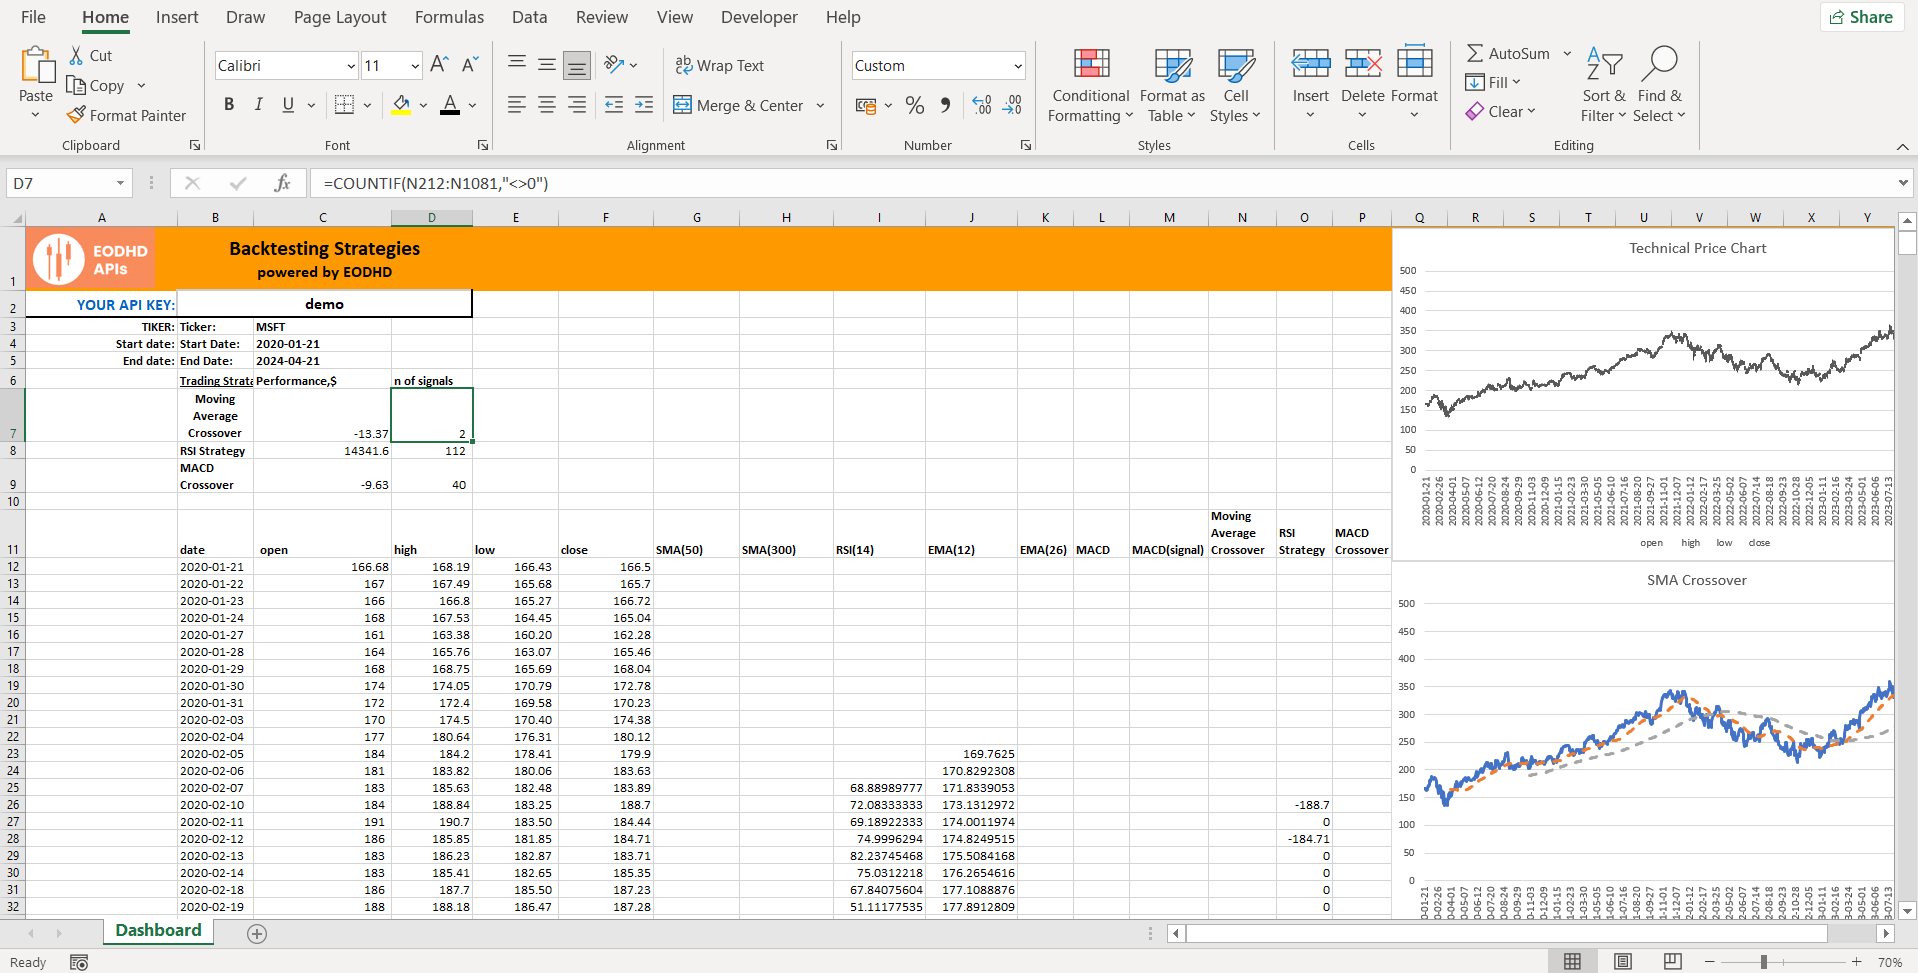
To backtest your technical analysis strategies for ETFs, follow these steps:
1. Choose a Backtesting Tool: Use platforms like TradingView, MetaTrader, or specialized software like Amibroker that support ETF data.
2. Select Your ETFs: Pick the ETFs you want to analyze based on your trading strategy.
3. Define Your Strategy: Clearly your entry and exit criteria, including indicators and timeframes.
4. Gather Historical Data: Download or access historical price data for the selected ETFs. Ensure it covers a significant time period for reliable results.
5. Implement the Strategy: Input your defined strategy into the backtesting tool. This may involve coding or using built-in features.
6. Run the Backtest: Execute the backtest to simulate trades based on your strategy and the historical data.
7. Analyze Results: Review metrics such as win rate, profit factor, and drawdown. Look for patterns in the performance.
8. Refine Your Strategy: Adjust your parameters and re-test to optimize performance based on your findings.
9. Forward Test: After backtesting, apply your strategy in a demo account to validate its effectiveness in real-time conditions.
This process allows you to evaluate the viability of your technical analysis strategies for day trading ETFs effectively.
Learn about How to Combine Technical Analysis with Day Trading Strategies
What Mistakes Should I Avoid When Using Technical Analysis for ETFs?
Avoid these mistakes when using technical analysis for day trading ETFs:
1. Ignoring Volume: Always analyze volume alongside price movements; it confirms trends and signals strength.
2. Overlooking Broader Market Trends: Don’t focus solely on the ETF; consider the underlying index and market conditions.
3. Relying on a Single Indicator: Use multiple indicators for confirmation instead of depending on one, like solely relying on RSI or MACD.
4. Neglecting Stop Losses: Always set stop losses to protect your capital from unexpected price swings.
5. Failing to Adapt: Be flexible with your strategy. What works today may not work tomorrow.
6. Overtrading: Stick to your plan and avoid entering too many trades, which can increase costs and risk.
7. Ignoring Time Frames: Use appropriate time frames for your trading style. Day traders benefit from shorter time frames, while swing traders may need longer ones.
8. Emotional Decision-Making: Base your trades on analysis, not on fear or greed.
By avoiding these pitfalls, you can enhance your effectiveness in day trading ETFs with technical analysis.
How Can I Stay Updated on Market Trends Affecting ETFs?
To stay updated on market trends affecting ETFs, follow these steps:
1. Use Financial News Websites: Check sites like Bloomberg, CNBC, and MarketWatch for real-time updates.
2. Follow ETF-Specific Resources: Subscribe to newsletters or blogs focusing on ETFs, like ETF.com or Morningstar.
3. Set Up Alerts: Use tools like Google Alerts for ETF-related news or specific market trends.
4. Monitor Social Media: Follow finance experts and ETF analysts on Twitter or LinkedIn for insights and trends.
5. Join Online Forums: Participate in communities like Reddit or StockTwits to discuss and share market insights with other traders.
6. Utilize Technical Analysis Tools: Use charting platforms like TradingView to analyze price movements and patterns in ETFs.
7. Attend Webinars and Workshops: Engage in educational sessions focused on ETF trading and market analysis.
These methods will keep you informed about market trends impacting ETFs and enhance your day trading strategies.
Learn about How to Stay Updated on AI Trends in Day Trading?
Conclusion about How to Use Technical Analysis for Day Trading ETFs
Incorporating technical analysis into your day trading strategy can significantly enhance your decision-making process and improve trading outcomes. By understanding key indicators, volume, and chart patterns, you can effectively identify profitable opportunities in ETFs. Always remember to manage risk and continuously refine your trading plan. For further insights and resources on optimizing your trading approach, rely on DayTradingBusiness to guide you through the complexities of technical analysis in the ETF market.
Learn about How to Use Technical Analysis for Day Trading Scalping