Did you know that the average day trader spends more time analyzing charts than a chef spends perfecting a soufflé? In the world of day trading, understanding the interplay between volume analysis and price action can be the key to success. This article breaks down essential concepts, from what volume analysis is and why it matters, to how price action can inform your trading decisions. We’ll explore key indicators, common mistakes, and effective tools for analyzing volume. By the end, you'll grasp how to combine both strategies to enhance your trading approach with insights from DayTradingBusiness. Get ready to boost your trading game!
What is Volume Analysis in Day Trading?
Volume analysis in day trading refers to evaluating the amount of shares or contracts traded during a specific time period to gauge market strength and potential price movements. It helps traders identify trends, confirm price action, and spot reversals. High volume often signals strong interest, while low volume may indicate weak momentum. Comparing volume with price action allows traders to make more informed decisions about entry and exit points.
How Does Price Action Work in Day Trading?
Price action in day trading refers to the movement of a security's price over time, which traders analyze to make decisions. Unlike volume analysis, which focuses on the quantity of shares traded, price action pays attention to patterns and trends in price movements. Traders look for specific formations, like candlestick patterns or support and resistance levels, to predict future price direction. Understanding price action helps traders gauge market sentiment and identify entry and exit points without relying heavily on indicators. In essence, price action provides a direct view of market behavior, making it crucial for day trading strategies.
Why is Volume Important in Day Trading?
Volume is crucial in day trading because it indicates the strength of a price move. High volume often confirms a trend, signaling that many traders support the price direction. This can lead to more reliable setups and reduced risk. Conversely, low volume may suggest weak momentum, making price movements less trustworthy. Analyzing volume alongside price action helps traders identify potential reversals or breakouts, ensuring informed decisions. Ultimately, volume provides insight into market sentiment, enhancing trading strategies.
How Can I Use Price Action for Trading Decisions?
To use price action for trading decisions, focus on analyzing the movement of prices on charts without relying on indicators. Look for key patterns like support and resistance levels, candlestick formations, and trends. Combine this with volume analysis to confirm the strength of price movements. For example, if a price breaks a resistance level with high volume, it suggests strong buying interest. Conversely, low volume during a breakout could indicate weakness. Always consider the context of price movements, such as news events or market sentiment, to enhance your trading decisions.
What are the Key Indicators of Volume Analysis?
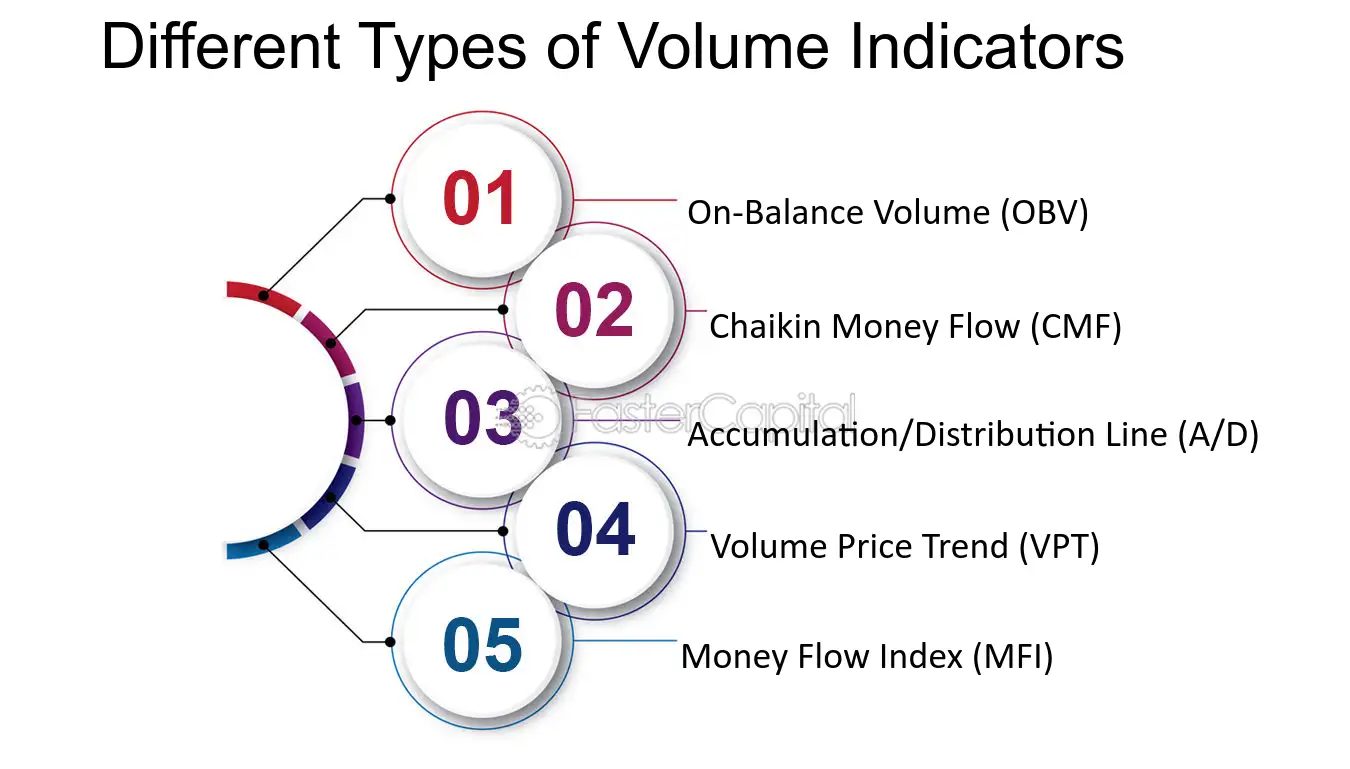
Key indicators of volume analysis in day trading include:
1. Volume Bars: Display total trades over time; spikes indicate strong interest.
2. Volume Moving Averages: Smooth out volume data to identify trends.
3. On-Balance Volume (OBV): Measures buying and selling pressure; rising OBV suggests bullish sentiment.
4. Accumulation/Distribution Line: Tracks price movement with volume; helps identify trends based on buying or selling pressure.
5. Chaikin Money Flow: Combines price and volume to assess buying and selling pressure over time.
These indicators help traders gauge market strength and potential price movements.
How to Identify Trends Using Price Action?
To identify trends using price action in day trading, focus on key price movements and patterns without relying on indicators. Look for higher highs and higher lows for an uptrend, or lower highs and lower lows for a downtrend. Analyze candlestick formations, like engulfing patterns or pin bars, to gauge market sentiment. Pay attention to volume; increasing volume with price movement can confirm a trend. Additionally, watch for breakouts above resistance or below support to signal potential trend changes. Keep your analysis simple and focus on the price's behavior to make informed trading decisions.
What are the Differences Between Volume and Price Action?
Volume refers to the number of shares or contracts traded in a specific period, while price action denotes the movement of a security's price over time. Volume analysis focuses on the strength or weakness of a price trend based on trading activity. In contrast, price action trading relies on historical price movements to make trading decisions, often using patterns and trends without indicators. High volume can confirm price trends, while low volume might indicate potential reversals. Essentially, volume provides context to price movements, and understanding both is crucial for effective day trading.
How Can Volume Analysis Improve My Trading Strategy?
Volume analysis can significantly enhance your trading strategy by providing insights into market strength and potential price movements. High volume often indicates strong interest and confirms price trends, while low volume can signal weak momentum or potential reversals. By combining volume analysis with price action, you can identify key support and resistance levels more accurately. For instance, if a price breaks through resistance with high volume, it’s a stronger signal to enter a trade. Conversely, if a price moves with low volume, it might suggest a lack of conviction, prompting you to be cautious. Use volume indicators like the Volume Weighted Average Price (VWAP) to gauge market sentiment and improve your entry and exit points.
When Should I Rely on Price Action Over Volume?
Rely on price action over volume when the market is trending strongly or in a clear range. In trending markets, price movements provide more reliable signals than volume fluctuations. Use price action to identify key support and resistance levels, especially during breakouts or reversals. In low-volume environments, price action can offer clearer insights since volume may not reflect true market sentiment. Focus on price patterns and candlestick formations to guide your trades, especially when volume is inconsistent or deceptive.
What Are Common Mistakes in Volume Analysis?

Common mistakes in volume analysis during day trading include:
1. Ignoring context: Traders often overlook the overall market trend when interpreting volume spikes.
2. Misreading volume signals: Assuming high volume always indicates strong buying or selling interest can lead to false conclusions.
3. Overemphasizing volume alone: Relying solely on volume without considering price action can result in poor decision-making.
4. Neglecting confirmation: Failing to wait for price confirmation after a volume change can lead to entering trades prematurely.
5. Confusing volume with volatility: High volume doesn’t always mean high volatility, which can mislead trading strategies.
Avoid these pitfalls to improve your volume analysis and enhance trading outcomes.
How Can I Combine Volume and Price Action in Trading?
To combine volume and price action in trading, analyze how volume changes with price movements. Look for confirmations where rising volume supports a price breakout or reversal. For instance, if a stock breaks resistance on high volume, it suggests strong buyer interest. Conversely, if prices rise but volume declines, it may indicate a lack of conviction and signal a potential reversal.
Use volume indicators like the Volume Moving Average to identify trends. In day trading, focus on key price levels where volume spikes occur, as these often indicate significant market interest. Always assess both factors together for more accurate trade decisions.
What Tools Are Best for Analyzing Volume?
The best tools for analyzing volume in day trading include:
1. Volume Indicators: Tools like Volume Moving Average and On-Balance Volume (OBV) help identify trends and momentum.
2. Charting Software: Platforms like TradingView or Thinkorswim provide detailed volume charts alongside price action.
3. Volume Profile: This tool shows the distribution of volume over price levels, highlighting key support and resistance areas.
4. Candlestick Patterns: Analyzing candlesticks with volume can reveal market sentiment and potential reversals.
5. Market Depth: Tools like Level 2 displays show real-time buy and sell orders, giving insights into volume dynamics.
Using these tools effectively can enhance your volume analysis compared to just relying on price action alone.
How Does Market Sentiment Affect Volume and Price Action?
Market sentiment drives both volume and price action in day trading. When traders are optimistic, volume typically increases as more participants buy, pushing prices up. Conversely, negative sentiment can lead to increased selling volume, causing prices to drop. High volume often confirms price trends; for instance, rising prices with strong volume suggest a solid bullish trend. In contrast, if prices rise on low volume, it may indicate a lack of conviction, potentially leading to reversals. Understanding sentiment helps traders interpret volume spikes and price movements accurately.
Learn about How Does Market Microstructure Affect Bid-Ask Spreads and Price Movements?
What Patterns Should I Look for in Price Action Trading?
In price action trading, focus on these key patterns:
1. Support and Resistance Levels: Identify where the price repeatedly bounces or reverses.
2. Candlestick Patterns: Watch for formations like pin bars, engulfing candles, and dojis that signal potential reversals or continuations.
3. Trend Lines: Draw lines connecting highs or lows to gauge the strength and direction of a trend.
4. Breakouts: Look for prices breaking through established support or resistance, often accompanied by increased volume.
5. Volume Analysis: Analyze volume spikes during price moves to confirm strength; higher volume on breakouts indicates a stronger move.
Combining these elements will enhance your ability to interpret market behavior effectively.
How Can I Measure Volume Effectively in Day Trading?
To measure volume effectively in day trading, focus on the following methods:
1. Volume Indicators: Use tools like the Volume Oscillator or On-Balance Volume (OBV) to assess buying and selling pressure.
2. Volume Trends: Compare current volume to average volume over a specific period to identify unusual activity.
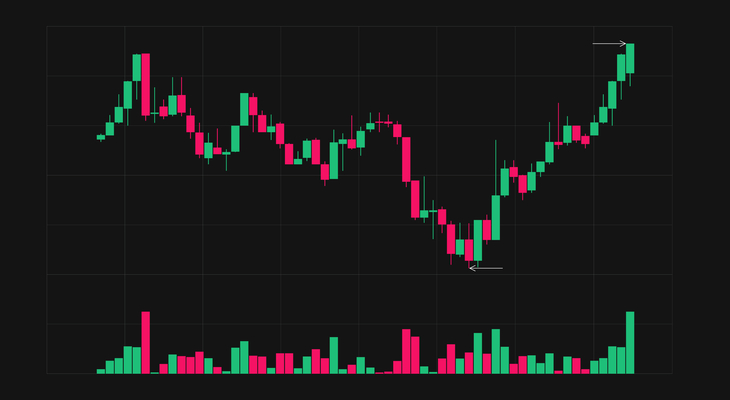
3. Volume Spikes: Look for sudden increases in volume, which can indicate potential price reversals or breakouts.
4. Price-Volume Relationship: Analyze how price moves with volume changes. Rising prices with increasing volume suggest strength, while rising prices with declining volume may signal weakness.
5. Contextual Analysis: Consider volume in relation to market news or events that could impact trading sentiment.
By integrating these techniques, you can enhance your volume analysis alongside price action for more informed trading decisions.
What Are the Benefits of Using Price Action in Day Trading?
Using price action in day trading offers several benefits. First, it helps traders make decisions based on real-time market movements, allowing for quick reactions to price changes. Second, price action simplifies trading strategies by focusing on price trends rather than relying on complex indicators. This clarity can improve trade execution and reduce analysis paralysis. Third, it enhances risk management, as traders can identify key support and resistance levels directly from price charts. Lastly, price action fosters a deeper understanding of market psychology, as it reflects the buying and selling pressure in the market.
Learn about What Are the Benefits of Using a Prop Firm for Day Trading?
Conclusion about Volume Analysis vs. Price Action in Day Trading
Incorporating both volume analysis and price action into your day trading strategy can significantly enhance your decision-making process. Volume provides insights into market strength, while price action reveals market sentiment and potential reversals. By understanding the interplay between these two elements, traders can identify trends more effectively and avoid common pitfalls. For those looking to deepen their trading knowledge and refine their strategies, DayTradingBusiness offers valuable resources and guidance on mastering these critical concepts.
Learn about The Role of Volume in Day Trading Chart Analysis
Sources:
- The behavior of daily stock market trading volume - ScienceDirect
- Does price efficiency increase with trading volume? Evidence of ...
- The Relation Between Price Changes and Trading Volume: A Survey
- Ex-dividend day trading: Who, how, and why?: Evidence from the ...
- Earnings news and small traders: An intraday analysis - ScienceDirect
- Do regulations work? A comprehensive analysis of price limits and ...