Did you know that the stock market has its own version of a "silent disco," where traders dance to the rhythm of trading volume? Understanding volume analysis is crucial for day traders looking to make informed decisions. This article explores essential volume analysis techniques, detailing how to interpret trading volume for strategic decision-making, identify volume trends in stock charts, and recognize the importance of volume in day trading strategies. We'll also cover how volume confirms breakout signals, the best volume indicators, and the risks of neglecting volume. By the end, you'll be equipped to combine volume analysis with other technical tools and manage your trading risk effectively. Dive in with DayTradingBusiness to enhance your trading game!
What are volume analysis techniques used by day traders?
Day traders use several volume analysis techniques, including:
1. Volume Spikes: Observing sudden increases in volume can indicate strong buying or selling interest, often leading to price reversals or breakouts.
2. Volume Indicators: Tools like the On-Balance Volume (OBV) and Volume Weighted Average Price (VWAP) help assess price trends relative to volume.
3. Volume Trend Analysis: Analyzing volume trends over time helps identify whether a trend is gaining strength or weakening.
4. Price-Volume Relationship: Day traders look for divergences between price movements and volume changes to spot potential reversals.
5. Accumulation/Distribution: This technique assesses whether a stock is being accumulated (bought) or distributed (sold), providing insights into market sentiment.
6. Volume Profiles: This technique shows the volume traded at specific price levels, helping traders identify support and resistance zones.
Using these techniques allows day traders to make informed decisions based on market dynamics.
How can I interpret trading volume for better decision-making?
To interpret trading volume for better decision-making, focus on these techniques:
1. Volume Spikes: Look for sudden increases in volume, which can indicate strong interest in a stock and potential price movement.
2. Volume Trends: Analyze volume trends alongside price trends. Rising prices with increasing volume suggest strength, while rising prices with decreasing volume may indicate a reversal.
3. Volume and Breakouts: Confirm breakouts with high volume. A breakout accompanied by strong volume signals a higher likelihood of a sustained move.
4. Volume Patterns: Familiarize yourself with patterns like accumulation (increasing volume on price declines) and distribution (increasing volume on price rises) to gauge market sentiment.
5. Relative Volume: Compare current volume to average volume over a specific period. High relative volume can indicate significant interest.
6. Use Indicators: Employ indicators like On-Balance Volume (OBV) or the Accumulation/Distribution line to assess buying and selling pressure.
Incorporate these techniques into your analysis to make informed trading decisions based on volume dynamics.
What is the importance of volume in day trading strategies?
Volume is crucial in day trading because it indicates the strength of price movements. High volume often confirms trends and signals potential reversals, making it easier to identify entry and exit points. Traders use volume analysis techniques, like volume spikes or moving averages, to gauge market interest and liquidity. This helps in making informed decisions, as higher volume typically reduces slippage and enhances trade execution. In summary, understanding volume allows day traders to capitalize on market opportunities effectively.
How do I identify volume trends in stock charts?
To identify volume trends in stock charts, look for these key techniques:
1. Volume Bars: Compare current volume bars to historical averages. Higher volume during price increases indicates strong buying interest.
2. Moving Averages: Use a volume moving average (e.g., 20-day) to smooth out fluctuations and highlight trends.
3. Volume Spikes: Identify sudden spikes in volume, as they often precede significant price movements.
4. Price-Volume Relationship: Analyze how volume correlates with price movements. Rising prices with increasing volume signal strength; falling prices with rising volume suggest weakness.
5. Accumulation/Distribution: Use this indicator to assess whether a stock is being accumulated (bought) or distributed (sold).
6. On-Balance Volume (OBV): Track cumulative volume to confirm trends; rising OBV with price increases indicates bullish sentiment.
Implement these techniques to gain insights into stock volume trends effectively.
What role does volume play in price movements?
Volume indicates the strength of price movements. High volume confirms trends, signaling strong buyer or seller interest. Low volume can suggest weakness or indecision, making price movements less reliable. Day traders use volume to identify potential reversals or continuations in price. For example, a breakout on high volume often leads to sustained movement, while a breakout on low volume may fail. Monitoring volume helps traders make informed decisions about entry and exit points.
How can I use volume to confirm breakout signals?
To confirm breakout signals using volume, look for increased trading volume accompanying the breakout. A significant rise in volume suggests strong market interest and validates the move. Ensure the volume is above the average for the period; this indicates that the breakout is likely genuine. If the breakout occurs on low volume, it may indicate a false signal. Additionally, compare volume levels to previous price movements; higher volume during an uptrend reinforces bullish breakouts, while increased volume during a downtrend confirms bearish breakouts.
What are the key indicators related to trading volume?
Key indicators related to trading volume for day traders include:
1. Volume Spike: A sudden increase in volume often signals strong interest and potential price movement.
2. Volume Moving Average: Comparing current volume to a moving average helps identify trends and reversals.
3. On-Balance Volume (OBV): This indicator uses volume to measure buying and selling pressure, indicating potential price direction.
4. Accumulation/Distribution: This shows whether a stock is being accumulated (bought) or distributed (sold), helping gauge market sentiment.
5. Chaikin Money Flow (CMF): Combines price and volume to indicate buying or selling pressure over a specific period.
6. Volume Profile: Displays trading activity at different price levels, highlighting areas of support and resistance.
These indicators help day traders make informed decisions based on market behavior.
How does volume analysis differ from price analysis?
Volume analysis focuses on the number of shares traded in a given time period, helping traders gauge market strength and potential price movements. Techniques include tracking volume spikes, identifying accumulation or distribution patterns, and using indicators like On-Balance Volume (OBV).
Price analysis, on the other hand, examines price movements and trends, using tools like moving averages and support/resistance levels to predict future price action. While price analysis looks at what the market is doing, volume analysis reveals how much interest there is behind those movements.
In day trading, combining both analyses provides a clearer picture of market dynamics, ensuring informed decisions.
What are the best volume indicators for day trading?
The best volume indicators for day trading include:
1. Volume: Simply track the number of shares traded; spikes can indicate strong price moves.
2. On-Balance Volume (OBV): Combines price and volume to show buying or selling pressure.
3. Accumulation/Distribution (A/D): Measures the cumulative flow of volume to determine market direction.
4. Chaikin Money Flow (CMF): Assesses the buying and selling pressure over a specific period, factoring in both price and volume.
5. Volume Weighted Average Price (VWAP): Reflects the average price a stock has traded at throughout the day based on volume, useful for intraday trading decisions.
Use these indicators to identify trends, confirm price movements, and make informed trading decisions.
How can I spot unusual volume spikes?
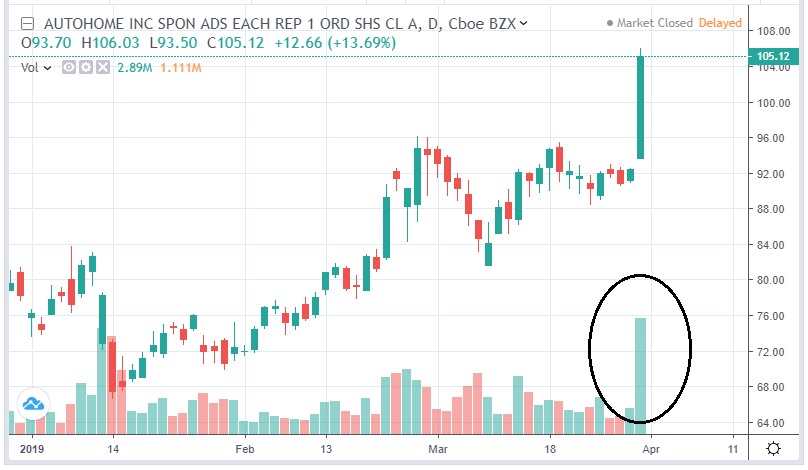
To spot unusual volume spikes while day trading, monitor real-time volume indicators on your trading platform. Look for a sudden increase in trading volume compared to the stock's average volume over a specific period, like the last 10 or 30 days. Use volume-based indicators like the Volume Moving Average or the On-Balance Volume (OBV) to confirm trends. Pay attention to price movements accompanying the volume spikes; significant price changes often validate the volume increase. Finally, check news sources or social media for any events driving the spike, such as earnings reports or market news.
What is average volume and why is it significant?
Average volume refers to the average number of shares traded in a particular stock over a specific time frame, typically calculated daily over a period like 20 or 50 days. It’s significant because it helps day traders gauge the liquidity of a stock and identify potential price movements. High average volume indicates strong interest and can lead to more significant price action, while low volume may suggest less interest and potential price stagnation. Understanding average volume aids traders in making informed decisions about entry and exit points.
How do I combine volume with other technical analysis tools?
To combine volume with other technical analysis tools for day trading, follow these steps:
1. Use Volume with Price Action: Look for volume spikes accompanying price movements. A strong price increase on high volume suggests a valid breakout, while low volume on a price rise may indicate a false move.
2. Integrate with Moving Averages: Apply moving averages to identify trends and confirm signals. For example, if the price crosses above a moving average with increasing volume, it strengthens the bullish signal.
3. Combine with Indicators: Use indicators like Relative Strength Index (RSI) or MACD alongside volume. If RSI shows overbought conditions but volume is declining, it might signal a potential reversal.
4. Utilize Volume Profiles: Analyze volume profiles to identify key support and resistance levels. High volume nodes indicate strong levels where price might react.
5. Watch for Divergences: Look for divergences between volume and price. If prices rise while volume decreases, it could indicate weakening momentum.
6. Incorporate Candlestick Patterns: Use candlestick patterns in conjunction with volume. A bullish engulfing pattern on high volume is more reliable than on low volume.
By integrating these techniques, you can enhance your trading strategies and make more informed decisions based on volume analysis.
Learn about How to Combine Fundamental and Technical Analysis in Day Trading
What are the risks of ignoring volume in day trading?
Ignoring volume in day trading can lead to several risks:
1. False Signals: Low volume can make price movements misleading, leading traders to act on false breakouts or reversals.
2. Liquidity Issues: Without considering volume, you might enter trades that are hard to exit, resulting in slippage and increased costs.
3. Inaccurate Trend Assessment: Volume reveals the strength of a trend. Ignoring it can cause you to misjudge momentum and miss out on profitable trades.
4. Higher Volatility: Low volume often correlates with increased volatility, risking larger losses on trades that could have been avoided with proper analysis.
5. Market Manipulation: Without volume analysis, you may fall victim to price manipulation by large players who can easily sway low-volume stocks.
In summary, volume is crucial for making informed, strategic decisions in day trading.
How can I use volume to manage my trading risk?
To manage trading risk using volume, focus on these techniques:
1. Volume Spikes: Look for sudden increases in volume as they often signal strong price movements. Enter trades when volume confirms a breakout or breakdown.
2. Volume Trends: Analyze volume trends alongside price movements. Increasing volume with rising prices suggests strong momentum, while decreasing volume may indicate a reversal.
3. Volume at Support/Resistance: Monitor volume at key support and resistance levels. High volume near these levels can indicate potential reversals, helping you set stop-loss orders effectively.
4. Volume Indicators: Use indicators like the On-Balance Volume (OBV) or Volume Weighted Average Price (VWAP) to gauge market sentiment and make informed entry and exit decisions.
5. Confirmation: Always use volume to confirm signals from other technical indicators. A signal is more reliable when supported by increased volume.
By integrating these volume analysis techniques, you can enhance your risk management strategy in day trading.
Learn about How to Use Charts to Manage Day Trading Risk
What is the relationship between volume and volatility?
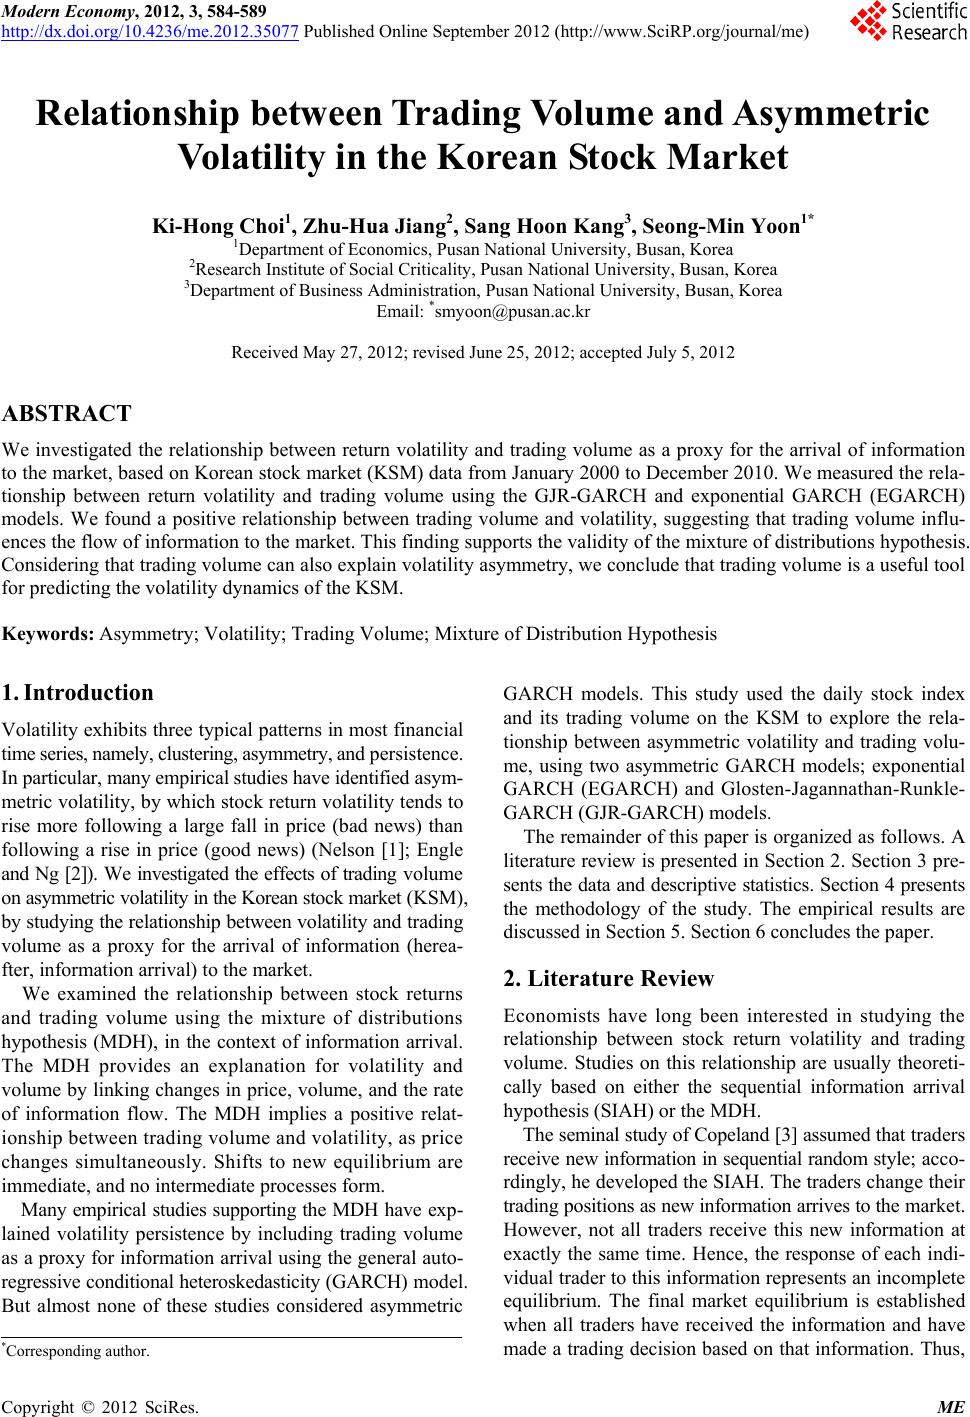
Volume and volatility are closely linked in day trading. High volume often indicates strong interest in a stock, which can lead to increased volatility as prices move rapidly due to buying or selling pressure. Conversely, low volume can result in lower volatility, as fewer trades mean less price movement. Traders use volume analysis to gauge potential volatility; spikes in volume typically signal upcoming price swings. Understanding this relationship helps traders make informed decisions about entry and exit points.
How can I practice volume analysis effectively?
To practice volume analysis effectively as a day trader, follow these steps:
1. Use Real-time Data: Monitor live charts with volume indicators. Platforms like TradingView or Thinkorswim offer tools to analyze volume alongside price action.
2. Identify Patterns: Look for volume spikes during key price movements. Note how volume correlates with price trends—higher volume often confirms trends, while lower volume may indicate reversals.
3. Combine with Other Indicators: Use volume in conjunction with moving averages or RSI. For example, if a stock breaks a moving average with high volume, it may signal a strong trend.
4. Practice with Historical Data: Replay past trading days and analyze volume alongside price movements. This helps in recognizing patterns without the pressure of real-time trading.
5. Set Volume Alerts: Use alerts for specific volume thresholds. This can help you react quickly to significant market moves.
6. Review Your Trades: After each trading day, assess your trades based on volume analysis. Identify what worked and what didn’t, adjusting your strategy accordingly.
7. Join Trading Communities: Engage in forums or groups where traders discuss volume analysis. Sharing insights can deepen your understanding and introduce new techniques.
By consistently applying these techniques, you’ll enhance your volume analysis skills and improve your day trading effectiveness.
Conclusion about Volume Analysis Techniques for Day Traders
Incorporating volume analysis techniques is essential for day traders aiming to enhance their decision-making and refine their strategies. Understanding the relationship between volume and price movements can significantly impact trading outcomes. By utilizing key volume indicators and recognizing volume trends, traders can confirm breakout signals and manage risks more effectively. Ignoring volume can lead to missed opportunities and increased volatility, making it crucial to integrate these insights into your trading routine. For further guidance and in-depth resources, DayTradingBusiness is here to support your trading journey.
Learn about Top Sentiment Analysis Techniques for Day Traders