Did you know that the stock market is like a giant game of musical chairs, where understanding volume can help you know when to sit down? In this article, we dive into the crucial concepts of accumulation and distribution in volume analysis, essential for any trader looking to enhance their strategy. We explain what accumulation means in volume analysis, how distribution affects trading volume, and highlight key indicators to identify both phases. Discover why volume is pivotal in these processes, how to spot high volume during accumulation, and the nuances between accumulation and distribution phases. We also discuss the impact of volume on price movements, its role in forecasting market reversals, and common pitfalls to avoid. Plus, learn how news and institutional investors influence these dynamics. With insights from DayTradingBusiness, you'll be equipped to make more informed trading decisions.
What is accumulation in volume analysis?
Accumulation in volume analysis refers to the increased buying activity in a security, indicating that investors are purchasing shares, often before a price increase. It signals strong demand and can suggest a potential upward price movement. This is typically identified by rising volume alongside price stability or increases. Accumulation shows market confidence and can be a precursor to bullish trends.
How does distribution impact trading volume?
Distribution impacts trading volume by indicating the selling pressure in the market. When distribution occurs, large investors sell off their holdings, often leading to increased trading volume as more shares change hands. This heightened activity can signal a potential price decline, as supply exceeds demand. Conversely, low distribution typically results in lower trading volume, suggesting stability or accumulation. High trading volume during distribution phases often highlights a shift in market sentiment, making it crucial to monitor for potential trends.
What are the key indicators of accumulation?
Key indicators of accumulation include increasing volume on price increases, higher lows in price action, and reduced volatility. Look for bullish candlestick patterns, significant buying interest at support levels, and a divergence between price and volume. Additionally, the presence of institutional buying and a gradual build-up of positions typically signals accumulation.
How can I identify distribution in market trends?
To identify distribution in market trends, look for high trading volume during price declines, indicating selling pressure. Analyze price movements: if prices rise but volume decreases, it may signal weakening demand. Use technical indicators like the Accumulation/Distribution Line, which reflects buying and selling activity. Observe resistance levels; repeated failures to break through can suggest distribution. Lastly, watch for bearish divergences where price rises but indicators like RSI or MACD decline, signaling potential distribution.
Why is volume important in accumulation and distribution?
Volume is crucial in accumulation and distribution because it indicates the strength of price movements. High volume during accumulation signals strong buying interest, suggesting a potential price increase. Conversely, high volume in distribution indicates significant selling pressure, which can lead to price declines. Analyzing volume helps traders confirm trends and identify potential reversals, making it a key factor in decision-making.
What does a high volume during accumulation indicate?
A high volume during accumulation indicates strong buying interest and confidence among investors. It suggests that a significant number of shares are being purchased, often at lower prices, which can lead to potential upward price movement. This high volume reflects increased demand, signaling a possible trend reversal or bullish sentiment in the market.
How do I differentiate between accumulation and distribution phases?
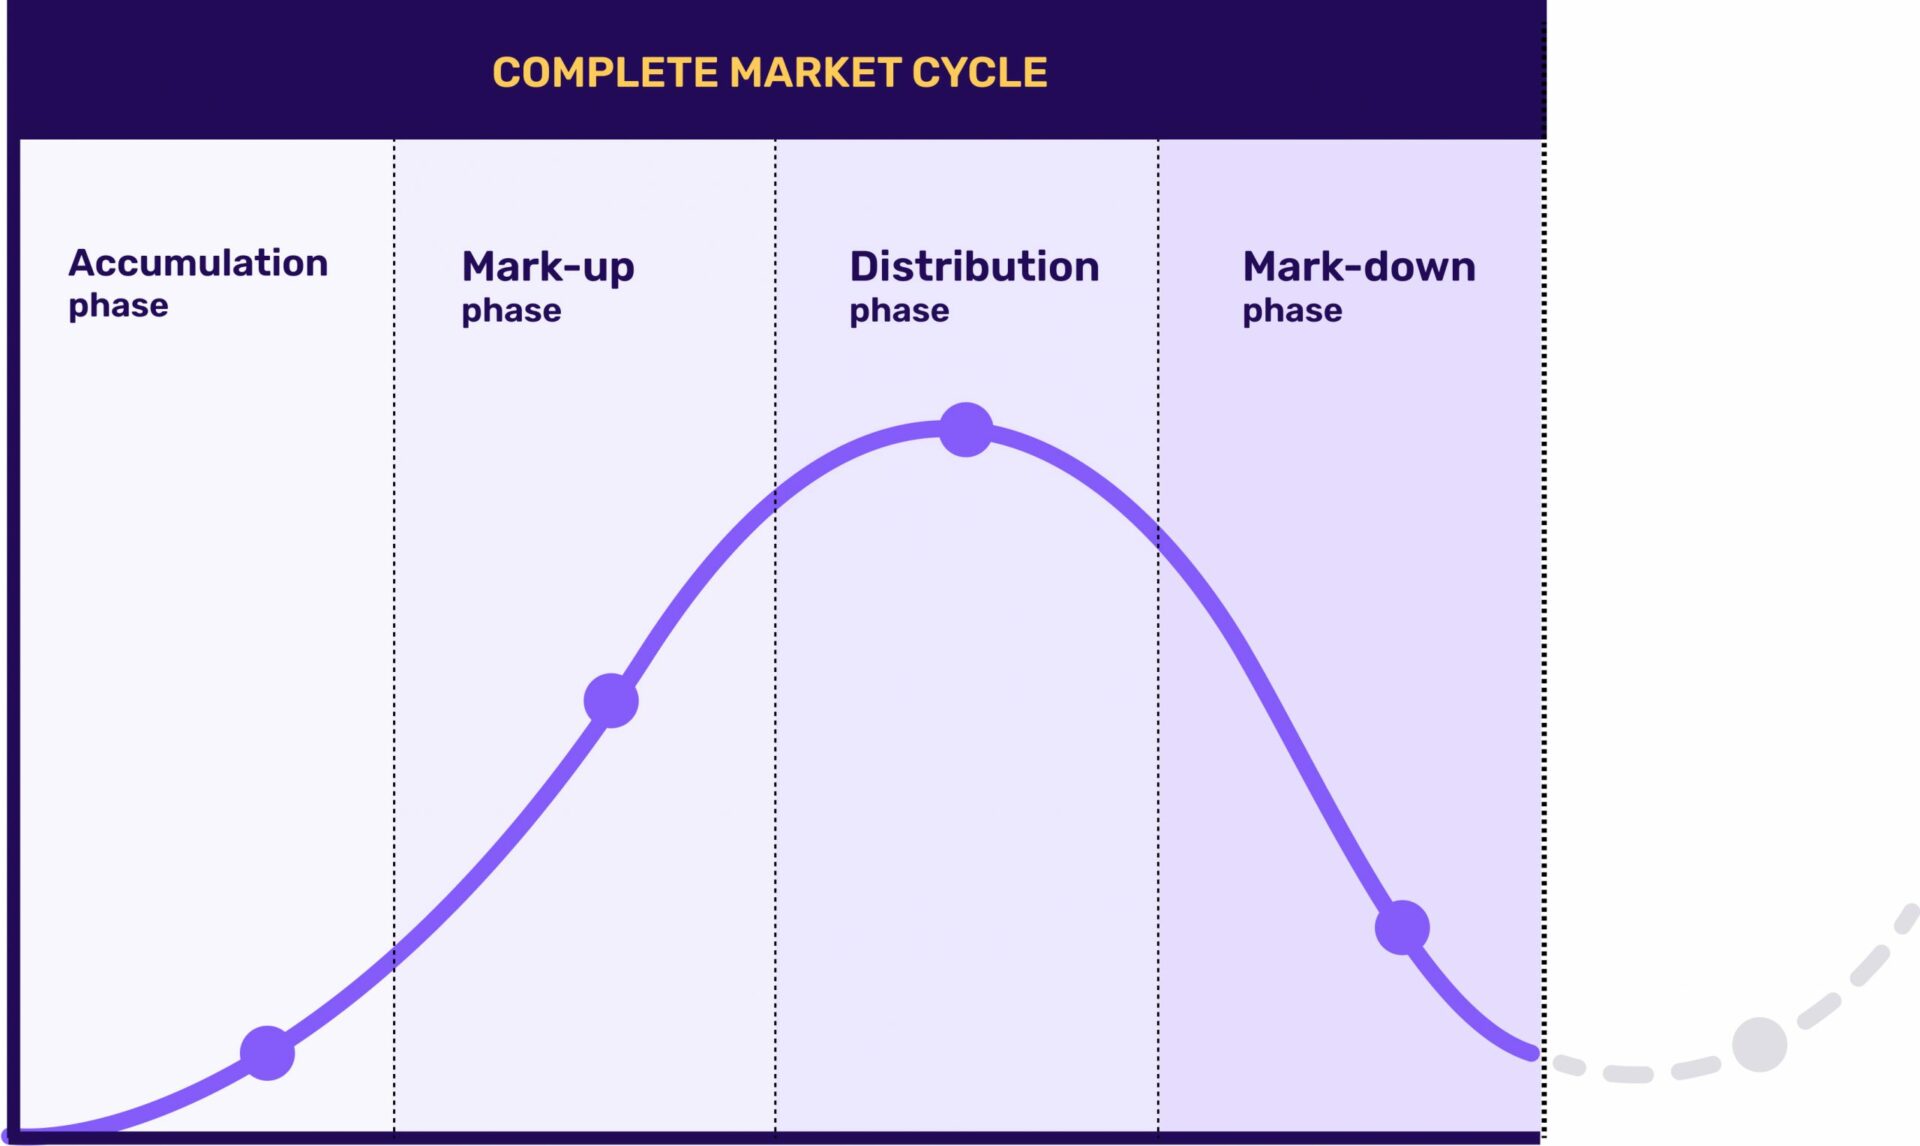
To differentiate between accumulation and distribution phases, look for volume patterns and price movements.
In the accumulation phase, prices are stable or slightly increasing with higher volume, indicating that smart money is buying. You'll often see lower price volatility and a gradual upward trend.
In contrast, during the distribution phase, prices rise but then stabilize or decline with increasing volume, signaling that large holders are selling. Look for signs of exhaustion in buying and a shift to higher volatility.
Key indicators include price consolidation at resistance levels (distribution) and support levels (accumulation). Always consider the context of overall market trends for clarity.
What role does volume play in price movements?
Volume indicates the strength of price movements. High volume during price increases suggests strong buying interest, signaling accumulation. Conversely, high volume during price declines indicates strong selling pressure, suggesting distribution. Low volume can mean weak price movements, often leading to reversals or lack of conviction. Tracking volume helps traders assess market sentiment and confirm trends.
How can I use volume to forecast market reversals?
To use volume for forecasting market reversals, observe accumulation and distribution patterns. When price rises on increasing volume, it indicates accumulation, suggesting a potential continuation. Conversely, if prices rise but volume declines, it hints at weakening momentum, signaling a possible reversal.
Look for high volume during price declines, signaling distribution. If prices drop on low volume, it suggests a lack of selling pressure, indicating a potential reversal. Watch for volume spikes at key support or resistance levels; these can indicate a shift in market sentiment. Always combine volume analysis with price action for more reliable forecasts.
What patterns should I look for during accumulation?
Look for increasing volume with price stability during accumulation. Watch for higher lows and higher highs, indicating buying pressure. Confirm accumulation with bullish divergence on momentum indicators like RSI. Identify consolidation phases where price moves sideways, suggesting readiness for a breakout. Also, pay attention to large volume spikes, as they may signal institutional buying.
How can distribution affect stock liquidity?
Distribution can significantly impact stock liquidity by increasing the supply of shares available for sale. When large investors or institutions distribute their holdings, it creates more shares on the market, which can lead to a higher trading volume. This heightened activity can enhance liquidity, making it easier for buyers and sellers to execute trades without causing large price fluctuations. Conversely, if distribution is heavy and not matched by buying interest, it can reduce liquidity, leading to wider bid-ask spreads and more difficulty in executing trades.
What are common mistakes in interpreting volume trends?
Common mistakes in interpreting volume trends include confusing high volume with strong trends, overlooking context like market conditions, and failing to distinguish between accumulation and distribution. Many traders misinterpret spikes in volume as a signal to buy or sell without analyzing the price movement accompanying it. Ignoring the direction of price relative to volume can lead to false conclusions, such as assuming a bullish trend when volume increases during a price decline. Additionally, not considering the time frame can skew understanding; a volume surge on a daily chart might not hold the same significance as on a weekly chart. Always analyze volume in conjunction with price action to avoid these pitfalls.
How does news impact accumulation and distribution?
News impacts accumulation and distribution by influencing market sentiment and trader behavior. Positive news can lead to increased buying (accumulation), driving prices up, while negative news often triggers selling (distribution), pushing prices down. For example, a strong earnings report might cause investors to accumulate shares, whereas a scandal could lead to widespread distribution. The volume of trading often spikes around news events, reflecting how information alters perceptions and actions in the market.
Can accumulation occur in bearish markets?
Yes, accumulation can occur in bearish markets. Investors may buy undervalued assets, anticipating a future price rebound. This buying pressure, despite overall negative sentiment, indicates accumulation.
What tools can help analyze volume for accumulation and distribution?
To analyze volume for accumulation and distribution, use these tools:
1. Volume Profile: Displays volume at specific price levels, helping identify where accumulation occurs.
2. On-Balance Volume (OBV): Combines price and volume to indicate buying or selling pressure.
3. Accumulation/Distribution Line: Measures the cumulative flow of money, showing whether more is being accumulated or distributed.
4. Chaikin Money Flow (CMF): Assesses buying and selling pressure over a set period, indicating accumulation or distribution trends.
5. Moving Average Convergence Divergence (MACD): While primarily a momentum indicator, it can signal accumulation or distribution when combined with volume analysis.
These tools provide insights into market behavior and help identify potential buy or sell signals.
How do institutional investors influence accumulation and distribution?
Institutional investors influence accumulation and distribution by controlling large volumes of shares, which impacts market trends. During accumulation, they buy stocks quietly to avoid driving prices up, often using strategies like block trades. This can signal bullish sentiment, leading to increased buying from retail investors.
In distribution, they sell holdings strategically to maximize profits, often causing price drops. Their trading patterns can create market momentum, making it crucial for other investors to analyze volume changes and price movements to understand market dynamics.
Conclusion about Understanding Accumulation and Distribution in Volume
In summary, understanding accumulation and distribution in volume analysis is crucial for effective trading strategies. Recognizing the key indicators and patterns allows traders to make informed decisions, particularly in forecasting market reversals. High volume during accumulation can signal strong buying interest, while distribution phases may indicate potential sell-offs. By leveraging tools and insights from volume trends, traders can enhance their market analysis. For deeper insights into these concepts and more, explore the resources available at DayTradingBusiness.
Sources:
- Nanoparticle biodistribution coefficients: A quantitative approach for ...
- Hotspots for selected metal elements and microbes accumulation ...
- Managing discolouration in drinking water distribution systems by ...
- Understanding the aggregation, consumption, distribution and ...
- Accumulation of perfluoroalkyl substances in human tissues ...
- Accumulation and distribution of polycyclic aromatic hydrocarbons in ...