Did you know that the average person’s sneeze travels at about 100 miles per hour, yet most traders still underestimate the power of volume in their trades? In the world of trading, understanding volume is crucial for identifying market breakouts and making informed decisions. This article delves into how volume signals breakouts, its relationship with price movement, and its importance in technical analysis. You’ll learn practical strategies for spotting potential breakouts, essential volume indicators, and how to differentiate between bullish and bearish scenarios. We’ll also address common misconceptions, the impact of low volume on reliability, and strategies for analyzing volume trends effectively. With insights from DayTradingBusiness, you’ll enhance your breakout trading strategies and make smarter decisions based on robust volume metrics.
How does volume indicate market breakouts?
Volume indicates market breakouts by showing the strength behind price movements. A sudden increase in volume during a breakout suggests strong interest and confirms the price direction. For instance, if a stock breaks above a resistance level with high volume, it likely signals a sustained upward trend. Conversely, low volume during a breakout may indicate a false move and a potential reversal. Monitoring volume helps traders assess the legitimacy of breakouts, making it a crucial factor in trading decisions.
What is the relationship between volume and price movement?
Volume is a key indicator in identifying breakouts. When price moves significantly with high volume, it suggests strong conviction behind the movement, signaling a likely continuation. Conversely, low volume during price changes can indicate weakness, making the breakout less reliable. Essentially, increasing volume confirms the strength of a price trend, while decreasing volume raises doubts about its sustainability.
Why is volume important in technical analysis?
Volume is crucial in technical analysis because it confirms the strength of price movements. High volume during a breakout indicates strong investor interest, suggesting the trend is likely to continue. Conversely, low volume can signal a lack of conviction, making the breakout less reliable. Traders often look for volume spikes to validate their trades and increase the probability of success.
How can I use volume to spot potential breakouts?
To spot potential breakouts using volume, monitor price movements alongside volume spikes. A breakout is more reliable when accompanied by a significant increase in volume, ideally at least 1.5 to 2 times the average volume. Look for these volume spikes at key resistance or support levels. If the price breaks through a resistance level and volume surges, it suggests strong buying interest, indicating a potential upward trend. Conversely, if a price drops below support with high volume, it signals a likely downward breakout. Always confirm with additional indicators for better accuracy.
What are the key volume indicators for breakout trading?
Key volume indicators for breakout trading include:
1. Volume Spikes: A sudden increase in volume during a price breakout suggests strong buyer or seller interest.
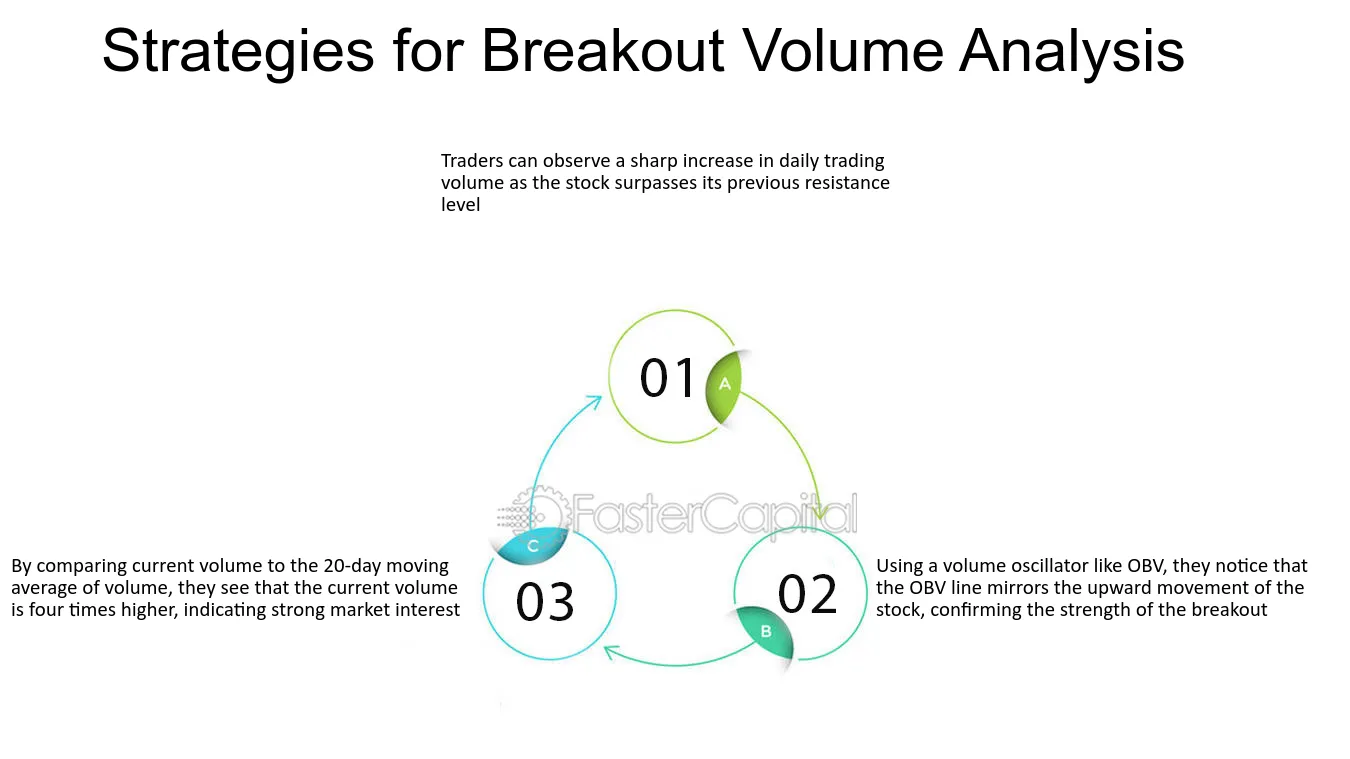
2. Average Volume: Compare current volume to a moving average (e.g., 20-day average) to confirm breakout strength. A significant increase indicates momentum.
3. On-Balance Volume (OBV): This indicator combines price movement with volume to show buying or selling pressure. A rising OBV during a breakout strengthens the signal.
4. Accumulation/Distribution Line: This measures the cumulative flow of money in and out of an asset. An upward trend during a breakout indicates accumulation.
5. Volume Oscillator: This tool shows the difference between two volume moving averages. A positive reading during a breakout can signal a strong trend.
Using these volume indicators helps traders confirm breakouts and avoid false signals.
How does low volume affect breakout reliability?
Low volume during a breakout often signals weaker reliability. When a breakout occurs with low trading volume, it suggests less conviction among traders, making it more likely to reverse. High volume, on the other hand, indicates strong interest and support for the price movement. In essence, low volume can lead to false breakouts, while high volume reinforces the breakout's validity.
What volume patterns should I look for during breakouts?

During breakouts, look for increased volume that significantly exceeds the average volume for the previous periods. A strong breakout typically shows volume spiking by 50% or more compared to the past few days. Confirm the breakout by ensuring that volume supports the price movement; if prices rise and volume increases, it's a bullish signal. For bearish breakouts, the same principle applies—higher volume during a price drop indicates strength in the move. Also, watch for volume trends; consistent increase in volume leading up to a breakout can signal potential continuation.
How can volume confirm a breakout's validity?
Volume confirms a breakout's validity by indicating strong investor interest and commitment. When a price breaks above resistance or below support, high volume suggests that many traders support the move, making it more likely to sustain. Conversely, low volume can signal a lack of conviction, which may lead to a false breakout. For example, if a stock breaks out of a resistance level with volume significantly above its average, it’s a stronger signal that the breakout is genuine.
What are the common misconceptions about volume in breakouts?
Common misconceptions about volume in breakouts include:
1. High Volume Always Indicates Strength: Many believe that high volume guarantees a strong breakout, but it can also signal exhaustion or a false breakout.
2. Low Volume Means Weakness: Some traders think low volume during a breakout indicates weakness, but it can also mean a lack of interest before a significant move.
3. Volume Should Always Increase: While increasing volume is often seen as a confirmation signal, sometimes breakouts can occur with consistent volume, especially in trending markets.
4. Volume Is Only Important at Breakouts: Traders often focus solely on volume during breakouts, neglecting its importance in the preceding consolidation phase, which can provide context.
5. Ignoring Context: Many overlook the broader market context; volume must be assessed alongside price action and market conditions to gauge breakout validity.
Understanding these misconceptions can enhance your ability to analyze breakouts effectively.
How does volume differ in bullish vs. bearish breakouts?
In bullish breakouts, volume typically surges as prices rise, indicating strong buyer interest and confirming the breakout. In contrast, bearish breakouts often see a spike in volume as prices fall, reflecting heightened selling pressure and validating the downward move. High volume in both scenarios suggests a stronger, more reliable breakout, while low volume can signal potential reversals or false breakouts.
What role does volume play in false breakouts?
Volume is crucial in identifying false breakouts. High volume during a breakout signals strong conviction and increases the likelihood of a genuine move. Conversely, if a breakout occurs on low volume, it often indicates a lack of support, making it more susceptible to reversal. Thus, watch for volume spikes to confirm breakouts; without them, the breakout may be false.
How can I analyze volume trends over time?
To analyze volume trends over time, track the volume of trades alongside price movements on a chart. Look for patterns where increasing volume accompanies price increases, indicating strong buying interest. Conversely, if price rises with declining volume, it may signal a lack of conviction. Use moving averages to smooth out volume data and identify significant shifts. Compare current volume to historical averages to spot anomalies that could indicate potential breakouts. Keep an eye on volume spikes, as they often precede major price movements.
What tools can help me measure trading volume effectively?
To measure trading volume effectively, use tools like TradingView, ThinkorSwim, and MetaTrader. These platforms offer volume indicators, real-time data, and customizable charts. Additionally, consider using volume profile analysis tools like Market Profile or Volume-at-Price to identify key levels. For a more in-depth analysis, tools like NinjaTrader and TradeStation provide advanced volume analysis features.
How do institutional investors use volume to identify breakouts?
Institutional investors analyze volume to spot breakouts by looking for significant increases in trading activity alongside price movements. When volume spikes during a price rise, it signals strong interest, indicating a potential breakout. Conversely, a breakout accompanied by low volume may suggest a lack of conviction. They also compare current volume against historical averages to identify unusual trading patterns. This helps them confirm the strength of a breakout and make informed investment decisions.
Learn about How Do Institutional Traders Use Volume and Order Flow Data?
What are the best practices for trading breakouts with volume analysis?
To effectively trade breakouts using volume analysis, follow these best practices:
1. Confirm Breakouts with Volume: Ensure that the breakout occurs on higher-than-average volume. This indicates strong interest and validates the move.
2. Look for Volume Spikes: A significant increase in volume, ideally 50% above the average, can signal a reliable breakout.
3. Use Volume Indicators: Incorporate tools like the On-Balance Volume (OBV) or Volume Moving Averages to gauge momentum and confirm trends.
4. Avoid Low-Volume Breakouts: Steer clear of breakouts with low volume, as these can lead to false signals and quick reversals.
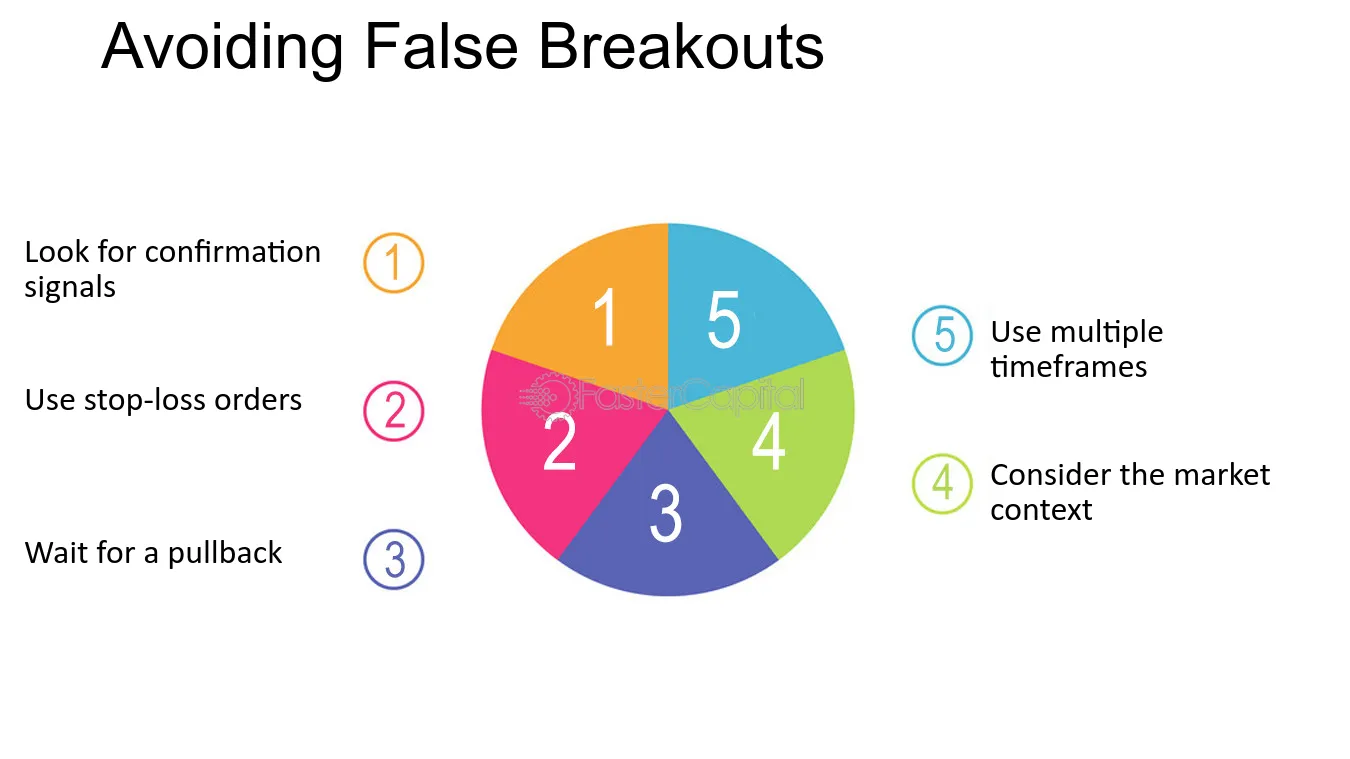
5. Set Clear Entry and Exit Points: Define your entry point above the breakout level and set stop-loss orders just below the breakout point to manage risk.
6. Monitor Price Action Post-Breakout: After a breakout, watch for sustained volume and price movement to confirm that the trend is continuing.
7. Consider Market Context: Analyze broader market conditions and news events that could impact volume and price action.
By following these practices, you can enhance your chances of successfully trading breakouts with volume analysis.
Learn about Best Practices for Conducting Volume Analysis in Day Trading
How can I improve my breakout strategies using volume metrics?
To improve your breakout strategies using volume metrics, focus on these key points:
1. Volume Confirmation: Look for breakouts accompanied by higher-than-average volume. This indicates strong interest and reduces the likelihood of false breakouts.
2. Volume Patterns: Analyze volume trends prior to the breakout. Increasing volume in the days leading up to a breakout suggests building momentum.
3. Volume Spikes: Identify significant volume spikes at breakout points. A sharp increase often signals a shift in market sentiment.
4. Volume Ratio: Compare current volume to the average volume over a specific period. A ratio above 1.5 to 2 can signal a strong breakout.
5. Volume and Price Correlation: Ensure that price movements align with volume changes. If prices rise with increasing volume, it’s a bullish sign.
6. Use Volume Indicators: Tools like On-Balance Volume (OBV) or the Accumulation/Distribution line can help gauge buying or selling pressure.
Incorporate these volume metrics into your analysis to enhance your breakout strategies effectively.
Conclusion about The Role of Volume in Identifying Breakouts
In summary, understanding volume is crucial for successfully identifying market breakouts. By analyzing the relationship between volume and price movement, traders can enhance their technical analysis and improve the reliability of their trading strategies. Recognizing key volume indicators and patterns allows for better decision-making, while also clarifying misconceptions about volume's role in breakouts. For those looking to refine their trading approach, leveraging volume metrics can significantly boost breakout strategies. For more in-depth insights and expert guidance, DayTradingBusiness is here to support your trading journey.
Sources:
- Identifying gaps and providing recommendations to address ...
- Early Career Breakout Session: “Balancing Our Many Roles ...
- Identification and verification immune-related regulatory network in ...
- Integrated NASA and Private Astronaut Crews Readiness Needs ...
- Automatic detection of fractures and breakouts patterns in acoustic ...