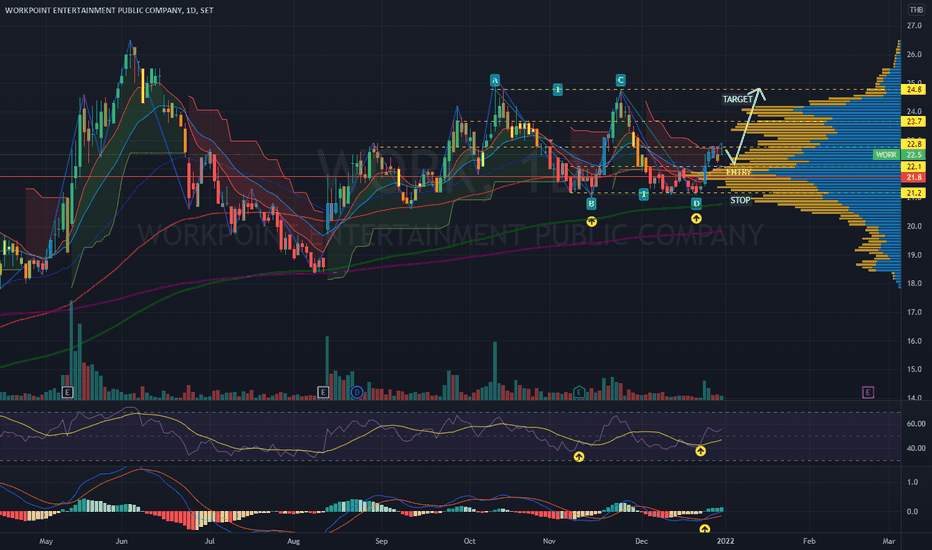
Did you know that the average person blinks about 15-20 times per minute, which is roughly the same frequency at which traders should be monitoring volume in the markets? Understanding volume is crucial for successful day trading strategies, as it influences price movements and confirms trading signals. In this article, we’ll explore why volume matters in day trading, the best indicators to use, and how to analyze trends effectively. We’ll also cover the risks of low volume, its impact on liquidity, and how institutional traders leverage volume for their strategies. By incorporating volume analysis into your routine, you can enhance your trading success. Let’s dive into these essential insights brought to you by DayTradingBusiness.
Why is volume important in day trading?
Volume is crucial in day trading because it indicates the strength of a price movement. High volume means more participation, which can confirm trends and reduce the likelihood of false signals. It helps traders identify potential entry and exit points, ensuring they make informed decisions. Additionally, volume reveals liquidity, allowing for quicker trades without significant price changes. Without adequate volume, a trader may struggle to execute trades effectively or may face slippage.
How does volume affect price movement in day trading?
Volume directly impacts price movement in day trading by indicating the strength of a price trend. Higher volume typically signals strong investor interest, leading to more significant price changes. For example, if a stock rises on high volume, it often suggests a genuine bullish trend, while low volume can indicate weak momentum. Traders use volume to confirm breakouts; a breakout accompanied by high volume is more likely to sustain. Conversely, a breakout on low volume may signal a false move. In summary, monitoring volume helps traders assess the reliability of price movements and make informed decisions.
What are the best volume indicators for day trading?
The best volume indicators for day trading include:
1. Volume Bars: Show trading activity over time, helping you spot trends and reversals.
2. On-Balance Volume (OBV): Measures buying and selling pressure, indicating potential price movements.
3. Accumulation/Distribution Line: Combines price and volume to show whether a stock is being accumulated or distributed.
4. Chaikin Money Flow: Assesses the buying and selling pressure over a specific period, indicating market sentiment.
5. Volume Moving Average: Smooths out volume spikes to identify unusual activity.
Using these indicators can enhance your day trading strategy by providing insights into market momentum and potential reversals.
How can I analyze volume trends for day trading?
To analyze volume trends for day trading, follow these steps:
1. Use Volume Indicators: Incorporate indicators like Volume Moving Average or On-Balance Volume (OBV) to track changes over time.
2. Compare Volume to Price: Look for divergences between volume and price movements. High volume with rising prices can indicate strong momentum, while high volume with falling prices may signal reversals.
3. Focus on Key Levels: Monitor volume at support and resistance levels. Increased volume at these points can confirm breakouts or rejections.
4. Timeframe Analysis: Analyze volume on multiple timeframes (e.g., daily, hourly, and 5-minute charts) to identify trends and significant moves.
5. News and Events: Pay attention to upcoming news or earnings reports that can spike volume.
6. Volume Patterns: Identify patterns like accumulation or distribution, which can signal potential price direction.
Implementing these strategies will enhance your understanding of volume trends in day trading.
What role does volume play in confirming trading signals?
Volume confirms trading signals by indicating the strength of a price movement. High volume during a price increase suggests strong buying interest, reinforcing a bullish signal. Conversely, high volume on a price drop indicates strong selling pressure, validating a bearish signal. Low volume can signal a lack of conviction, making signals less reliable. In day trading, monitoring volume alongside price action helps traders make informed decisions and avoid false breakouts.
How does low volume impact day trading decisions?
Low volume can significantly impact day trading decisions by increasing volatility and reducing liquidity. Traders may face wider spreads, making it harder to enter and exit positions without substantial price shifts. This can lead to false breakouts or reversals, complicating trade execution. Additionally, low volume can signal a lack of interest in a stock, making it risky to rely on price movements. Day traders often seek higher volume for more reliable signals and smoother trades.
What are the risks of trading on low volume?
Trading on low volume increases the risk of price manipulation, higher volatility, and slippage. Low liquidity can lead to larger spreads, making it harder to enter or exit positions at desired prices. Additionally, it can result in unexpected price swings, as even small trades can significantly impact the market. This unpredictability can amplify losses and hinder effective risk management.
How can I use volume to identify breakouts?
To use volume for identifying breakouts in day trading, look for a sharp increase in volume that accompanies a price move beyond a resistance level. This surge indicates strong interest and confirms the breakout. Monitor volume trends; if volume is consistently higher than the average, it reinforces the breakout's validity. Additionally, consider using volume indicators like the Volume Weighted Average Price (VWAP) to assess momentum. Always combine volume analysis with price action for clearer signals.
What is the relationship between volume and volatility in day trading?
In day trading, volume and volatility are closely linked. High volume often indicates strong interest in a stock, which can lead to increased volatility as prices fluctuate more dramatically. Traders rely on volume to confirm price movements; rising prices with high volume suggest strength, while falling prices with high volume can signal weakness. Conversely, low volume can result in less price movement and increased risk, as it may indicate a lack of interest or liquidity. Thus, understanding volume helps traders anticipate potential volatility and make informed decisions.
How do institutional traders use volume in their strategies?

Institutional traders use volume to gauge market activity and liquidity. High volume indicates strong interest in a stock, helping them identify trends and validate price movements. They often look for volume spikes to signal potential entry or exit points. By analyzing volume alongside price action, they can confirm the strength of a trend or detect reversals. Institutions may also use volume to assess the impact of their trades, ensuring they don’t significantly move the market. Overall, volume is crucial for making informed trading decisions and managing risk effectively.
Learn about How Do Institutional Traders Use Volume and Order Flow Data?
Can volume help predict market reversals in day trading?
Yes, volume can help predict market reversals in day trading. High trading volume often precedes price changes, signaling strong investor interest and potential reversals. For instance, if a stock experiences a sudden spike in volume while approaching a support or resistance level, it may indicate a reversal. Additionally, low volume during a price move suggests weakness, hinting at a possible reversal soon. Monitoring volume alongside price action can enhance your trading strategy and improve decision-making.
How do I interpret volume spikes in day trading?
Volume spikes in day trading indicate heightened interest in a stock, often signaling potential price movements. When you see a sudden increase in volume, it can suggest that a trend is strengthening or that a reversal may be imminent. Compare the spike to average volume; significant deviations typically signify stronger conviction.
For example, a volume surge during an upward price movement might indicate bullish momentum, while a spike during a price drop could warn of bearish sentiment. Always consider the context, such as news events or earnings reports, as they can drive volume changes. Use these insights to inform your entry and exit strategies, aligning trades with volume trends for better outcomes.
Learn about How to Interpret Volume Spikes in Day Trading
Why should I consider volume alongside other technical indicators?

You should consider volume alongside other technical indicators because it confirms price movements. High volume during an uptrend signals strong buying interest, while low volume may indicate a lack of conviction. Volume can help identify potential reversals or breakouts, adding context to your trades. For instance, if a stock breaks resistance on high volume, it’s more likely to sustain that move. Incorporating volume into your day trading strategies enhances your analysis and decision-making process.
How does volume affect liquidity in day trading?
Volume directly impacts liquidity in day trading by determining how easily traders can buy or sell assets without affecting the price. Higher volume signifies greater market activity, leading to tighter spreads and quicker executions. In contrast, low volume can result in slippage and difficulty entering or exiting positions. Thus, day traders often prefer stocks with high volume to ensure they can execute trades efficiently and capitalize on short-term price movements.
Learn about How Do Market Makers and Liquidity Providers Affect Day Trading?
What volume-related strategies can improve day trading success?
1. Volume Confirmation: Use volume to confirm price movements. A price increase with high volume signals strength, while low volume suggests weakness.
2. Volume Spikes: Look for sudden volume spikes as potential entry or exit points. These often indicate significant market interest and can signal reversals or breakouts.
3. Volume Analysis Tools: Utilize tools like the Volume Moving Average to identify trends. If the current volume exceeds the average, it may indicate a strong trend.
4. Volume Patterns: Recognize volume patterns, such as accumulation (increased volume on price declines) or distribution (high volume on price rises), to gauge market sentiment.
5. Combine with Technical Indicators: Integrate volume with indicators like the Relative Strength Index (RSI) or Moving Average Convergence Divergence (MACD) to enhance decision-making.
6. Watch for Divergence: Identify divergence between price and volume. If price rises but volume falls, it may indicate a weakening trend.
7. Liquidity Awareness: Choose stocks with higher average daily volume for better liquidity, allowing for smoother entries and exits without significant price slippage.
Implementing these volume-related strategies can enhance your day trading success by providing clearer signals and better market insights.
How can I incorporate volume analysis into my day trading routine?
To incorporate volume analysis into your day trading routine, start by tracking volume alongside price movements on your charts. Look for volume spikes that accompany price breaks; this often indicates strong momentum. Use volume indicators like the On-Balance Volume (OBV) or the Volume Weighted Average Price (VWAP) to gauge the strength of a trend.
Before entering a trade, confirm that the volume supports your strategy—higher volume on bullish candles suggests buying interest, while high volume on bearish candles signals selling pressure. Set alerts for significant volume changes to help identify potential entry or exit points. Regularly review your trades to see how volume influenced your outcomes and adjust your strategy accordingly.
Learn about How to Incorporate Order Flow Analysis into Your Trading Routine
Conclusion about The Importance of Volume in Day Trading Strategies
Incorporating volume analysis into your day trading strategy is crucial for making informed decisions and enhancing your trading success. Understanding how volume influences price movement, confirms signals, and impacts liquidity can provide a significant edge. As you refine your approach, remember that effective volume indicators and trend analysis are essential tools. By leveraging these insights, you can navigate market dynamics more effectively. For comprehensive support and resources on mastering volume in your trading strategies, consider exploring the offerings of DayTradingBusiness.
Learn about The Importance of Volume in Day Trading Patterns