Did you know that the average person swallows eight spiders a year while sleeping? While that might keep you up at night, understanding trading volume can significantly enhance your day trading strategy. This article dives deep into the intricacies of volume in day trading, covering its importance, how to analyze it effectively, and the best indicators to use. You’ll learn how high and low volumes can impact stock prices, identify breakout stocks, and confirm trend reversals. Additionally, we’ll explore common volume patterns, the interplay between volume and volatility, and how to incorporate volume analysis into your trading strategy. With insights from DayTradingBusiness, you’ll avoid common pitfalls and improve your risk management, ensuring you navigate the trading landscape with confidence.
What is volume in day trading and why is it important?
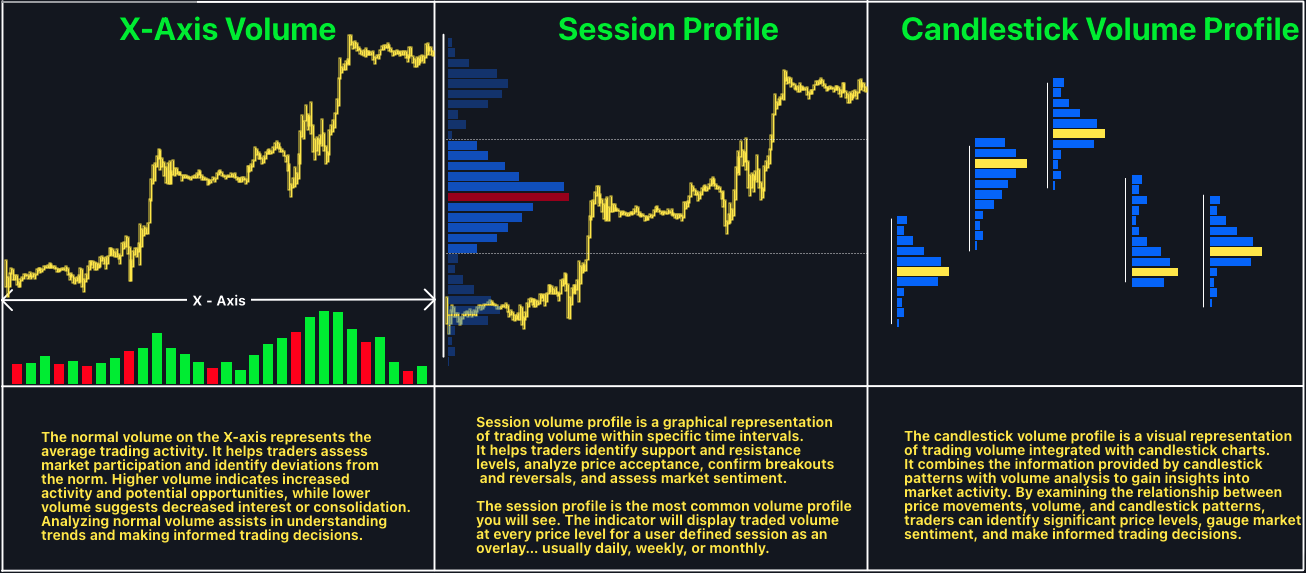
Volume in day trading refers to the number of shares or contracts traded in a specific period. It’s crucial because it indicates the strength of a price movement. High volume often confirms trends, suggesting that the movement is backed by significant market interest. Conversely, low volume can signal weakness or a potential reversal.
Using volume effectively can improve day trading by helping you identify entry and exit points. For example, if a stock is rising on high volume, it’s likely a strong move, making it a good time to buy. If a price drop occurs on low volume, it may be a moment to hold off on selling. Monitoring volume alongside price action can enhance decision-making, increasing the likelihood of profitable trades.
How can I analyze trading volume effectively?
To analyze trading volume effectively for day trading, follow these steps:
1. Monitor Volume Trends: Look for spikes in volume that accompany price changes. Increased volume often signals strong trends or reversals.
2. Compare with Historical Data: Assess current volume against historical averages. Higher-than-average volume indicates stronger conviction in price movements.
3. Use Volume Indicators: Employ indicators like the Volume Moving Average or On-Balance Volume (OBV) to gauge buying and selling pressure.
4. Watch for Volume Patterns: Identify patterns such as accumulation (rising prices with increasing volume) or distribution (falling prices with increasing volume).
5. Correlate with Price Action: Always analyze volume alongside price charts. A price breakout with high volume is more reliable than one with low volume.
6. Consider Timeframes: Analyze volume on multiple timeframes (e.g., 1-minute, 5-minute, daily) to capture different trading signals.
7. Use Volume as Confirmation: Confirm trades with volume; enter positions when volume supports the price direction.
By integrating these techniques, you can leverage volume analysis to enhance your day trading strategies.
What are the best volume indicators for day trading?
The best volume indicators for day trading include:
1. Volume: Simply track the total number of shares traded. High volume confirms price movements.
2. Volume Moving Average: Use a moving average of volume to identify trends and breakouts.
3. On-Balance Volume (OBV): This combines price movement with volume to indicate buying or selling pressure.
4. Accumulation/Distribution (A/D): Measures the cumulative flow of volume to indicate whether a stock is being accumulated or distributed.
5. Chaikin Money Flow (CMF): This indicator combines price and volume to show the buying and selling pressure over a specified period.
Incorporate these indicators to enhance your day trading strategy and make more informed decisions.
How does high volume affect stock price movements?
High volume typically indicates increased interest and activity in a stock, which can lead to more significant price movements. When a stock experiences high volume during an uptrend, it often confirms the strength of that trend, suggesting that the price may continue to rise. Conversely, high volume during a downtrend may signal that selling pressure is strong, potentially leading to further declines.
Day traders can use volume to identify potential breakouts or reversals. For example, if a stock breaks through resistance with high volume, it may indicate a strong upward movement is likely. Similarly, if prices drop sharply with high volume, it could suggest that the stock is in a downtrend. Monitoring volume alongside price movements helps traders make informed decisions on entry and exit points.
What does low trading volume indicate for day traders?

Low trading volume indicates a lack of interest in a stock, which can lead to increased volatility and wider spreads. For day traders, this means potentially higher risk when entering or exiting positions. Low volume can also signal fewer opportunities for profitable trades, as it may be harder to execute orders at desired prices. Day traders should be cautious with low-volume stocks, as they might not provide the liquidity needed for quick trades.
How can volume help identify potential breakout stocks?
Volume helps identify potential breakout stocks by indicating strong interest and momentum. When a stock experiences a significant increase in volume, it often signals that a price movement is supported by many traders, enhancing the likelihood of a breakout. Look for volume spikes that accompany price movements above resistance levels; this suggests buying enthusiasm. Additionally, consistent high volume during an uptrend can confirm the stock's strength and potential for further gains. Use tools like volume averages to spot unusual activity, signaling that a breakout may be imminent.
What role does volume play in confirming trend reversals?
Volume acts as a key indicator in confirming trend reversals. When a trend reversal occurs, a significant increase in volume supports the change, signaling that many traders are participating in the new direction. For instance, if a stock is rising and then shows a sharp drop with high volume, it may indicate strong selling pressure, confirming a potential reversal. Conversely, a rise in price accompanied by low volume might suggest a lack of conviction in the new trend. Monitoring volume helps day traders validate their entries and exits, ensuring they align with market momentum.
How can I use volume in conjunction with price action?
To use volume with price action in day trading, follow these steps:
1. Confirm Trends: Look for rising volume accompanying price increases to confirm bullish trends. If price rises but volume falls, it may signal a reversal.
2. Identify Breakouts: Watch for breakouts above resistance or below support with increased volume. This indicates strong conviction and potential continuation.
3. Divergence Analysis: Look for divergence between price and volume. For example, if prices are making new highs but volume is declining, this could indicate a weakening trend.
4. Volume Spikes: Pay attention to volume spikes at key price levels. High volume during a pullback can indicate strong support or resistance.
5. Volume Moving Averages: Use volume moving averages to identify unusual activity. A spike above the average can signal potential trading opportunities.
6. Combine with Indicators: Pair volume analysis with indicators like RSI or MACD for better entry and exit points.
By integrating volume with your price action strategy, you can make more informed trading decisions.
What are the common volume patterns to watch for in day trading?
Common volume patterns to watch for in day trading include:
1. Volume Spikes: Sudden increases in volume often indicate strong interest in a stock, signaling potential breakout or breakdown points.
2. Volume Trend: Consistent volume increases during a price rise suggest strong buying interest, while rising volume during a price decline can indicate selling pressure.
3. Low Volume Pullbacks: Price corrections on low volume may suggest a lack of conviction, making them potential buying opportunities.
4. High Volume at Support/Resistance: A stock bouncing off support or resistance with high volume can signal a reversal or continuation of the trend.
5. Volume Divergence: If price moves up or down but volume decreases, it may indicate a weakening trend, warning traders of potential reversals.
Monitoring these patterns can enhance day trading strategies by providing insights into market sentiment and potential price movements.
How do volume spikes signal trading opportunities?
Volume spikes indicate increased buying or selling activity, often signaling potential trading opportunities. When volume rises sharply, it suggests strong interest in a stock, which can lead to price movement. Traders often look for these spikes as they may precede breakouts or reversals. For example, a sudden volume increase on a stock breaking resistance may indicate a bullish trend, while high volume during a price drop could signal panic selling. Monitoring volume alongside price action helps traders identify entry and exit points more effectively.
Learn about How to Interpret Volume Spikes in Day Trading
How can I interpret volume in different market conditions?
To interpret volume in day trading, consider the following market conditions:
1. Bullish Trends: High volume during price increases confirms strength. If volume spikes as prices rise, it signals strong buying interest.
2. Bearish Trends: Increased volume during price declines indicates selling pressure. A volume surge on down days suggests strong bearish sentiment.
3. Consolidation: Low volume during sideways movement shows indecision. Watch for a breakout with rising volume to confirm direction.
4. Breakouts: A breakout accompanied by high volume is more reliable. It indicates that the move is supported by significant market interest.
5. Reversals: Look for volume spikes at support or resistance levels. High volume during a reversal can signal a strong change in trend.
Use these volume interpretations to guide your trades effectively.
What mistakes should I avoid when using volume in day trading?
Avoid these mistakes when using volume in day trading:
1. Ignoring Volume Trends: Don’t just look at current volume; analyze volume trends over time for better insights.
2. Overvaluing Volume Alone: Don’t rely solely on volume without considering price action and market context.
3. Misinterpreting Volume Spikes: Be cautious; spikes can indicate both buying and selling pressure. Assess the accompanying price movement.
4. Failing to Confirm Signals: Always confirm volume signals with other indicators like moving averages or relative strength index (RSI).
5. Neglecting Market News: Major news can impact volume significantly. Stay updated to understand sudden volume changes.
6. Trading Low Volume Stocks: Avoid stocks with low volume, as they can lead to higher volatility and slippage.
7. Disregarding Timeframes: Different timeframes show different volume patterns. Ensure your analysis matches your trading strategy.
By steering clear of these mistakes, you can better leverage volume to enhance your day trading strategy.
How can volume analysis improve my risk management strategies?
Volume analysis can enhance your risk management strategies by providing insights into market strength and potential reversals. High volume during price moves indicates stronger trends, helping you identify entry and exit points more effectively. Conversely, low volume can signal weak trends, prompting you to tighten stop losses or avoid trades. Monitoring volume can also reveal support and resistance levels, allowing you to set more informed risk parameters. Ultimately, using volume data can lead to more precise trading decisions and reduce the likelihood of significant losses.
How do volume and volatility interact in day trading?
In day trading, volume and volatility are closely linked. High volume often precedes price movements, indicating strong market interest, while volatility measures the degree of price fluctuations. When volume spikes, it can lead to increased volatility, creating opportunities for traders. For instance, if a stock experiences a sudden surge in volume, it may indicate a breakout or breakdown, prompting traders to act. Conversely, low volume can lead to less volatility, making it harder to predict price movements. Successful day traders monitor volume trends to identify potential volatility, allowing them to enter or exit trades more effectively.
What are the differences between volume in stocks and options trading?
Volume in stocks refers to the total number of shares traded during a specific period, indicating market activity and liquidity. In options trading, volume represents the number of options contracts traded, reflecting interest in specific underlying assets.
The key differences include:
1. Measurement: Stock volume measures shares, while options volume measures contracts.
2. Liquidity Impact: High stock volume often signals strong liquidity; in options, high volume can indicate potential price movement in the underlying stock.
3. Market Sentiment: Stock volume can show general market sentiment, while options volume helps gauge sentiment about future price movements and volatility.
Using volume effectively in day trading can help you spot trends, confirm breakouts, and manage risk. High volume can signal entry or exit points, whether for stocks or options.
How can I incorporate volume analysis into my trading strategy?
To incorporate volume analysis into your day trading strategy, start by analyzing volume trends alongside price movements. Look for volume spikes that indicate strong buying or selling pressure, which can signal potential reversals or breakouts. Use volume indicators like the Volume Moving Average to identify average activity levels and spot anomalies.
Combine volume with other indicators, such as price action or momentum indicators, to confirm signals. For instance, if a stock breaks resistance with high volume, it’s a strong buy signal. Additionally, avoid trades on low-volume days as they can lead to increased volatility and false signals.
Finally, keep a trading journal to track how volume influences your trades, helping refine your strategy over time.
Learn about How to Incorporate Order Flow Analysis into Your Trading Routine
Conclusion about How to Use Volume to Improve Day Trading
Incorporating volume analysis into your day trading strategy is crucial for making informed decisions. Understanding the significance of trading volume, utilizing effective indicators, and recognizing volume patterns can enhance your ability to identify breakouts and trend reversals. By avoiding common pitfalls and effectively managing risk, you can leverage volume insights to optimize your trading performance. For further guidance and resources, explore the tools and expertise that DayTradingBusiness offers to elevate your trading skills.
Learn about How to Use Market Microstructure Data to Improve Day Trading Outcomes
Sources:
- The price discovery role of day traders in futures market: Evidence ...
- Can high trading volume and volatility switch boost momentum to ...
- Does price efficiency increase with trading volume? Evidence of ...
- Open volume and time to open on option-expiration days ...
- Asymmetric effect of trading volume on realized volatility ...