Did you know that a sudden spike in trading volume can be as surprising as finding a sock in the fridge? Understanding volume spikes is crucial for day traders, as they can signal potential price movements and market reversals. In this article, we delve into what volume spikes are, how to identify them on trading charts, and why they matter in your trading strategy. We’ll explore the causes behind these spikes, the indicators that best complement them, and how to distinguish between genuine and false signals. Additionally, we’ll discuss the role news plays in volume fluctuations and provide tools for effective volume analysis. Join us at DayTradingBusiness to sharpen your trading skills and integrate volume spikes into your risk management strategy.
What are volume spikes in day trading?
Volume spikes in day trading refer to sudden, significant increases in trading volume for a particular stock or asset. These spikes often indicate heightened interest or activity, which can precede price movements. Traders interpret volume spikes as potential signals for buying or selling opportunities. A spike during an upward price movement may suggest strong buying interest, while a spike during a price drop could indicate panic selling. Monitoring these spikes helps traders gauge market sentiment and make informed decisions.
How can I identify volume spikes on trading charts?
To identify volume spikes on trading charts, look for sudden increases in trading volume compared to average levels. Use volume indicators or overlays that highlight changes. Check for spikes occurring alongside price movements, as these often indicate strong buying or selling interest. Compare volume with previous periods to assess significance. Additionally, watch for spikes at key support or resistance levels, which can signal potential reversals or breakouts.
Why do volume spikes matter in day trading?
Volume spikes matter in day trading because they indicate increased interest and activity in a stock, signaling potential price movement. They can confirm trends, help identify reversals, and provide insights into the strength of price movements. For example, a sudden spike in volume during a price increase suggests strong buying interest, while a spike during a decline may indicate panic selling. Traders use these spikes to make informed decisions about entry and exit points, improving their chances of profit.
What causes volume spikes in stock trading?
Volume spikes in stock trading are primarily caused by sudden news events, earnings reports, or significant market developments. These factors can lead to increased buying or selling interest as traders react to new information. Additionally, large institutional trades can create volume spikes, as they often execute significant orders that impact market activity. Understanding these spikes is crucial for day trading, as they may indicate potential price movements or shifts in market sentiment.
How do I use volume spikes to inform my trading strategy?
To use volume spikes in your trading strategy, start by identifying significant increases in volume compared to the average. A volume spike often indicates heightened interest in a stock, which can signal potential price movements.
When you notice a spike, check for accompanying price action. If the price rises with increased volume, it may confirm a bullish trend. Conversely, if the price falls despite high volume, it could indicate selling pressure.
Incorporate volume spikes into your entry and exit points. For example, consider entering a trade when a volume spike occurs alongside a breakout above resistance. Use volume to set stop-loss orders; if volume drops after a spike, it may suggest a reversal.
Always combine volume analysis with other indicators to strengthen your strategy. This approach helps you make informed trading decisions based on real market activity.
What indicators work well with volume spikes?
Indicators that work well with volume spikes in day trading include the Relative Strength Index (RSI) for momentum confirmation, the Moving Average Convergence Divergence (MACD) for trend direction, and Bollinger Bands for volatility assessment. Additionally, the On-Balance Volume (OBV) helps gauge buying and selling pressure. Combining these indicators with volume spikes can enhance trading decisions and improve entry and exit points.
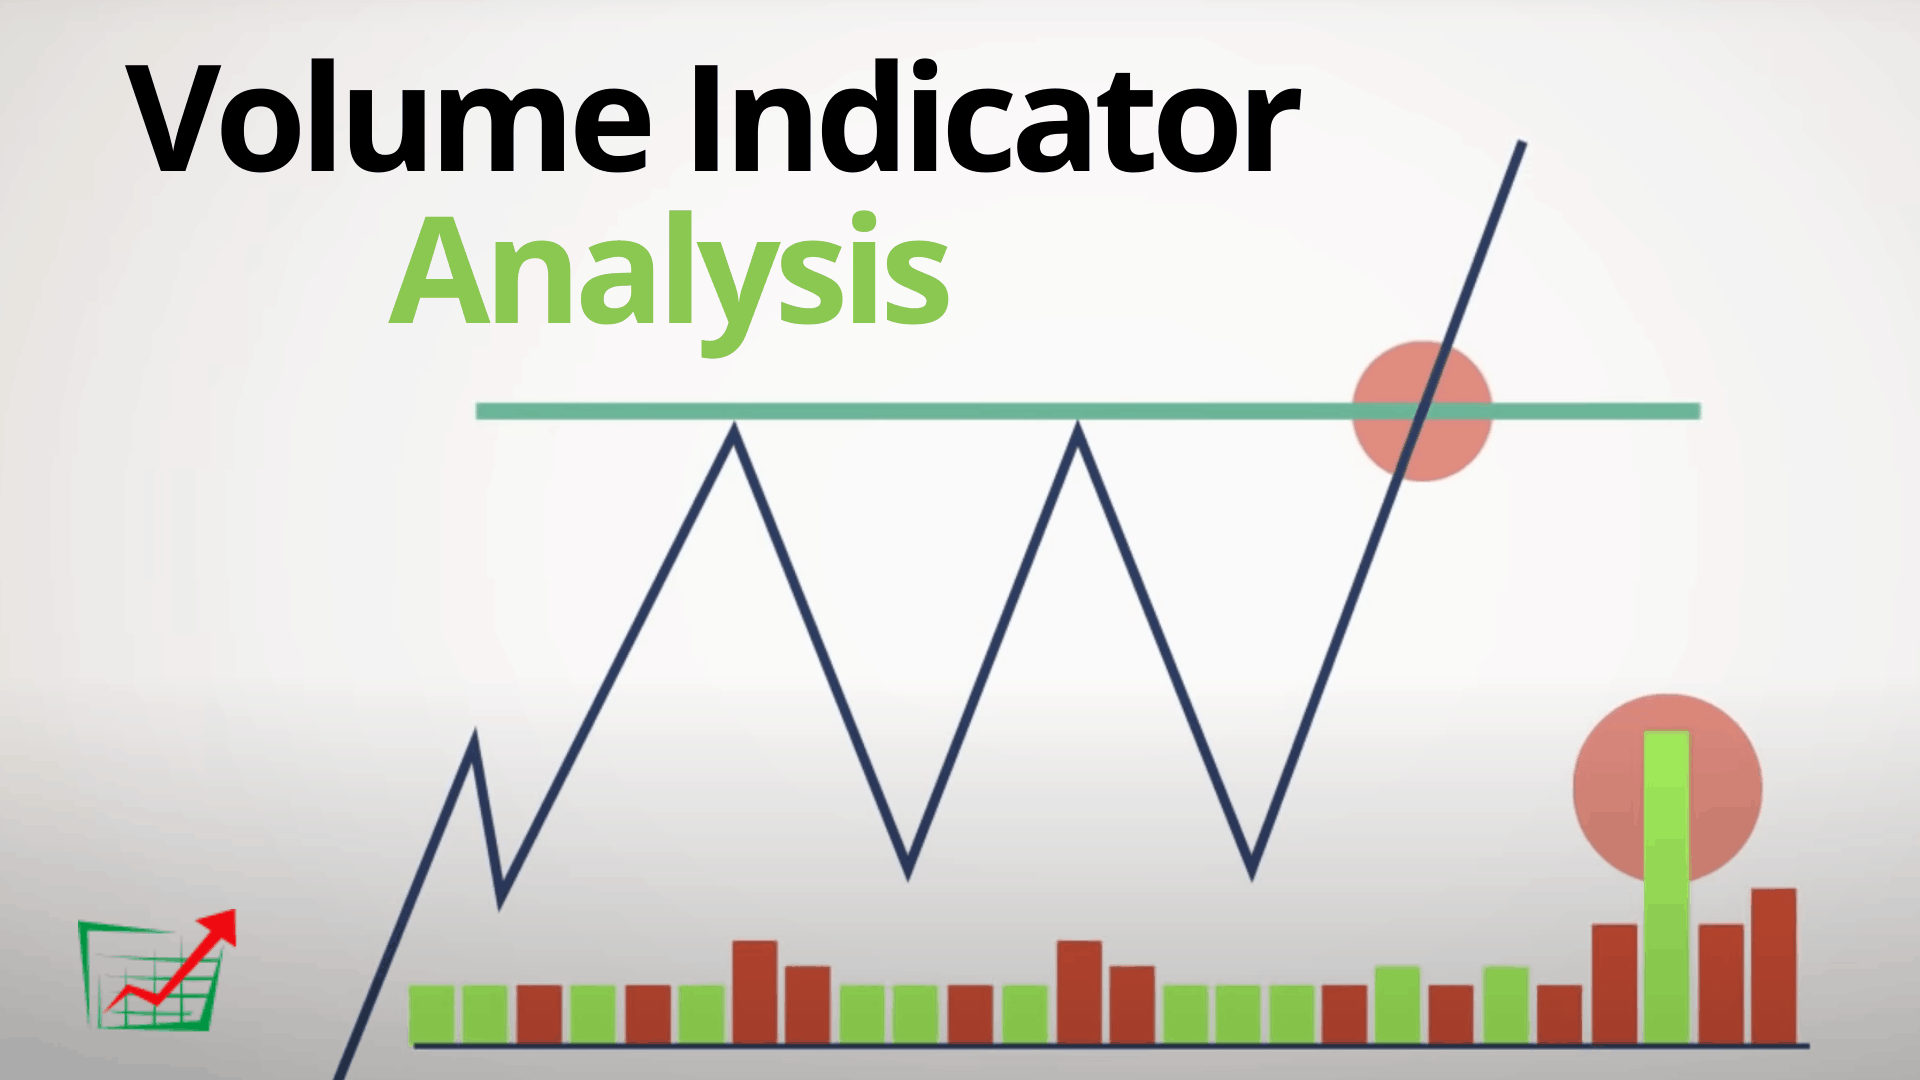
How can volume spikes signal potential price movements?
Volume spikes indicate increased trading activity, often signaling potential price movements. When volume surges, it suggests strong interest in a stock, hinting at possible breakouts or reversals. For day traders, high volume during an upward price movement can confirm bullish momentum, while a spike during a downward trend may indicate panic selling or profit-taking. Monitoring volume alongside price action helps traders identify trends and make informed decisions.
What are the different types of volume spikes?
Volume spikes in day trading typically fall into three types:
1. News-Driven Spikes: Occur due to breaking news, earnings reports, or significant announcements affecting a stock, leading to increased buying or selling.
2. Technical Spikes: Happen when a stock breaks through key support or resistance levels, triggering automatic buy or sell orders, often seen during chart pattern formations.
3. Pump and Dump Spikes: Result from coordinated efforts to artificially inflate a stock’s price, often followed by a rapid sell-off when the hype dies down.
Understanding these types helps traders interpret market sentiment and make informed decisions.
How important is volume analysis for day trading?
Volume analysis is crucial for day trading because it helps identify the strength of price movements. High volume during a price spike often indicates strong conviction, signaling potential continuation or reversal. Traders use volume spikes to confirm breakouts or the validity of trends. Without volume analysis, decisions may rely on misleading price movements. In summary, understanding volume is essential for effective day trading strategies.
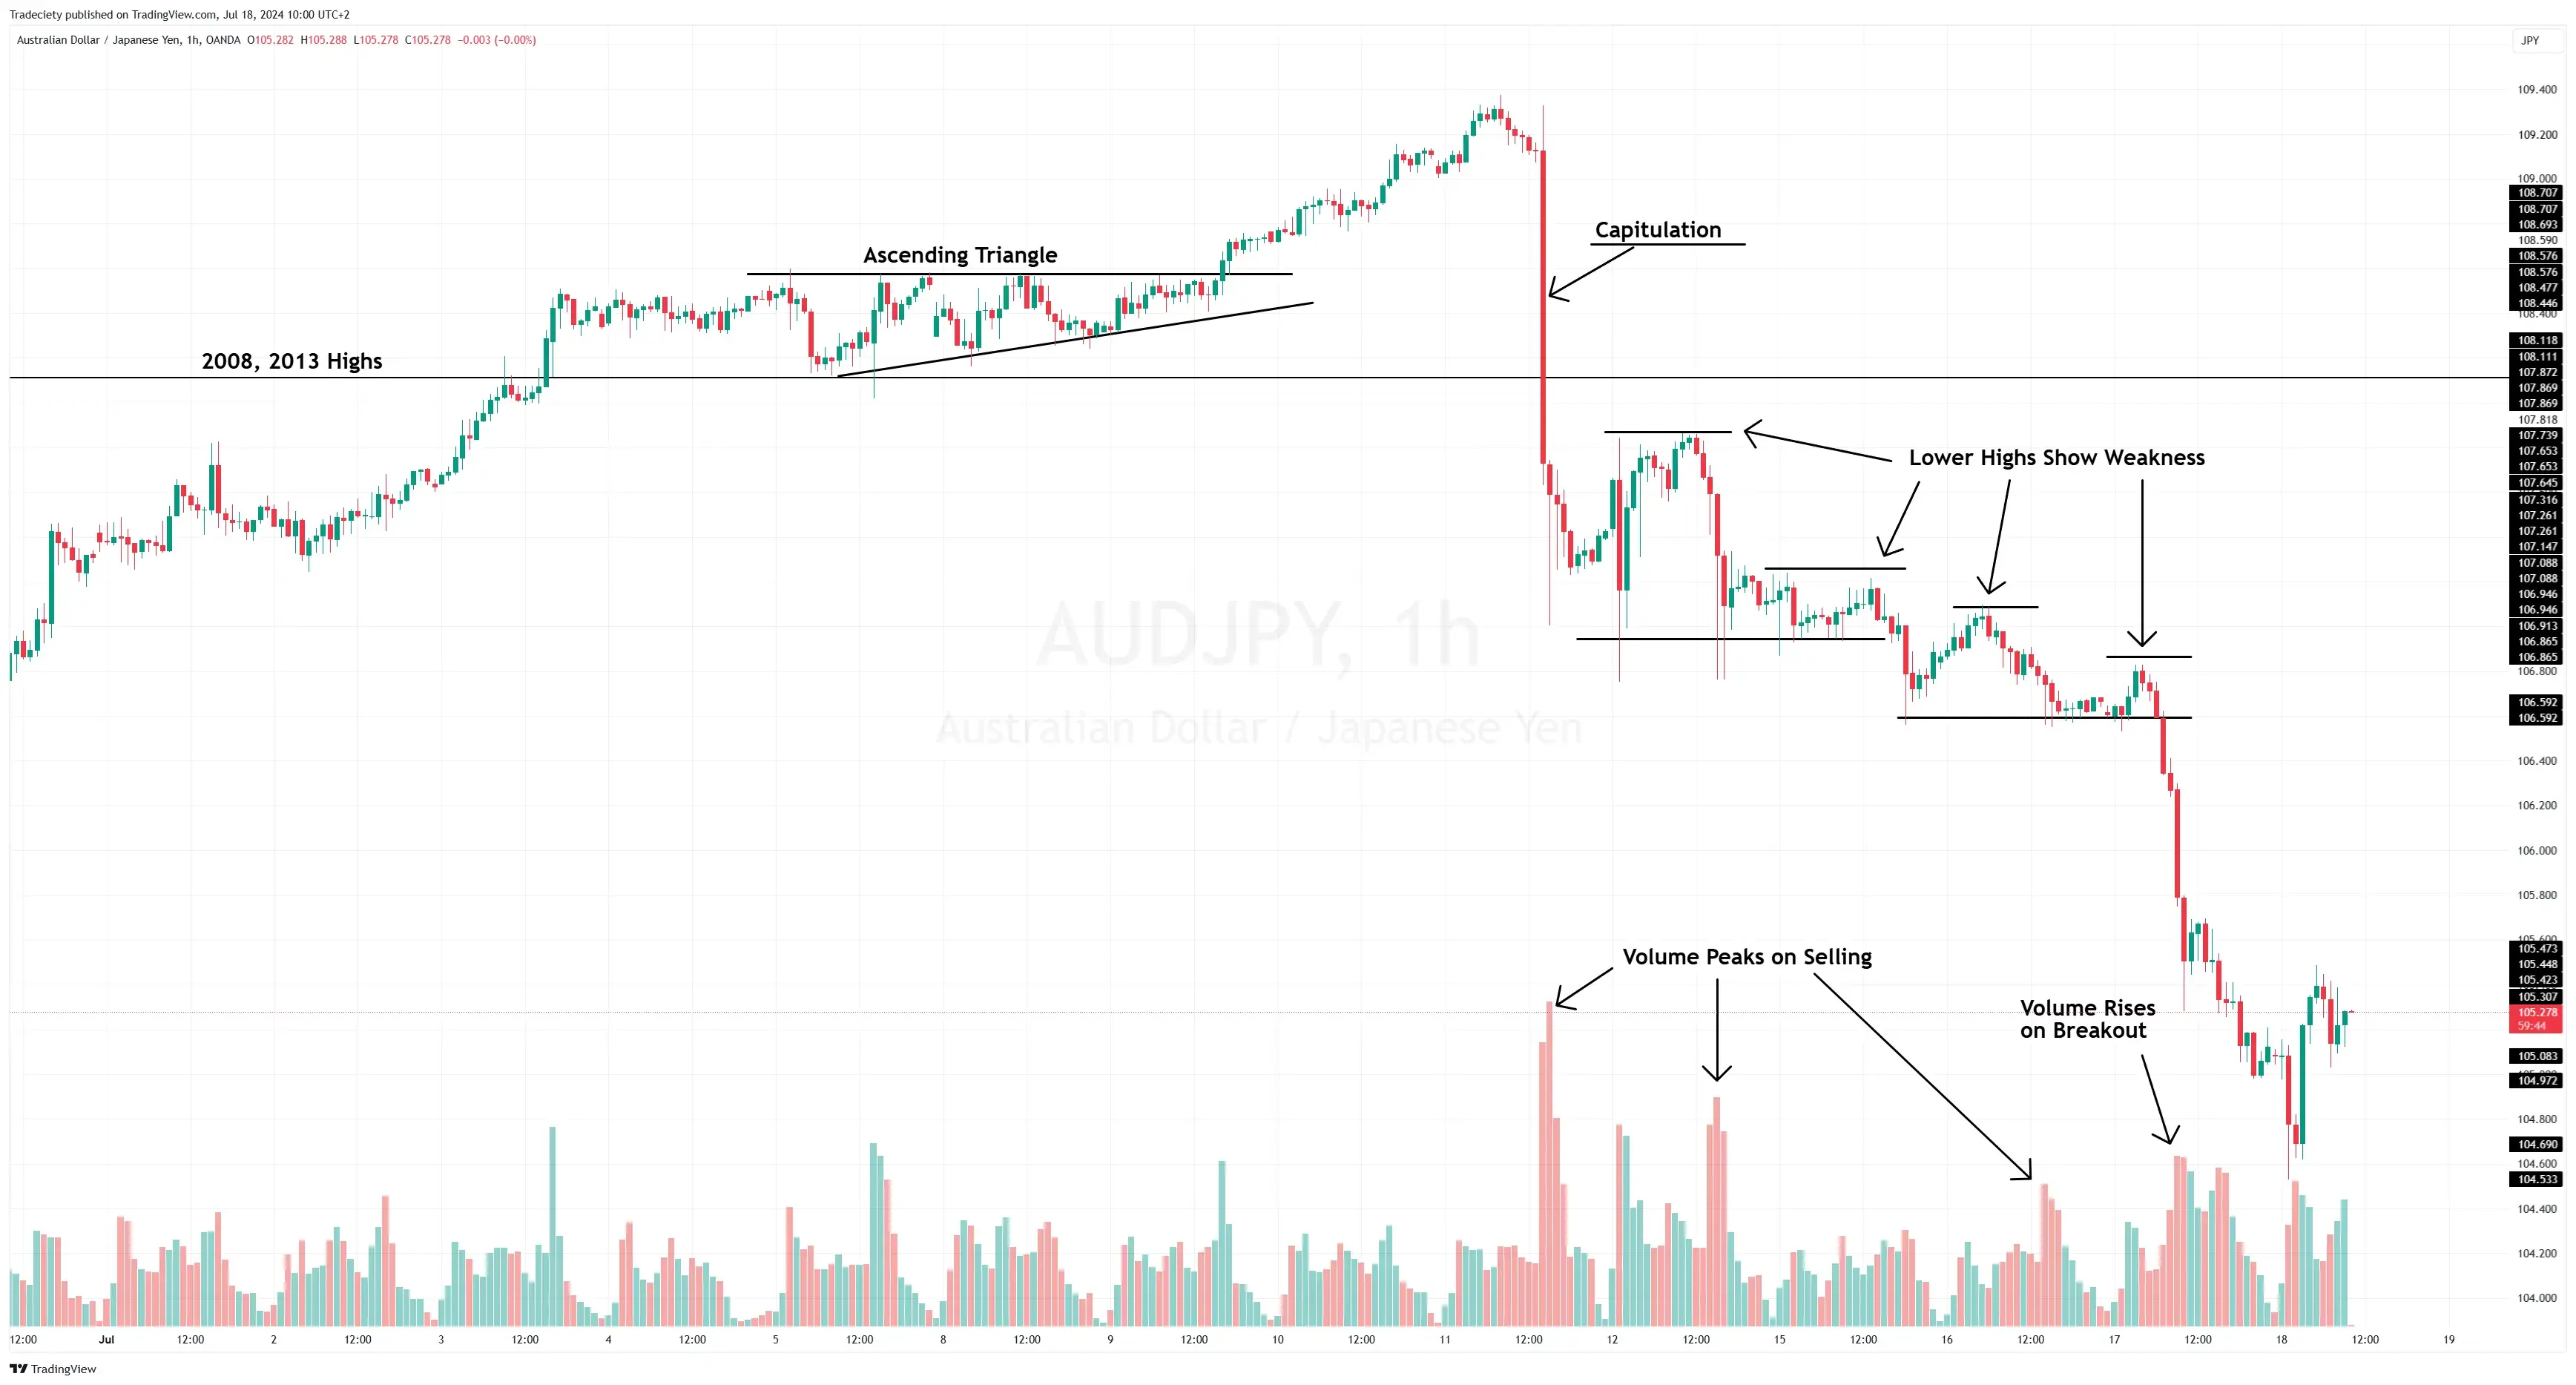
Can volume spikes predict market reversals?
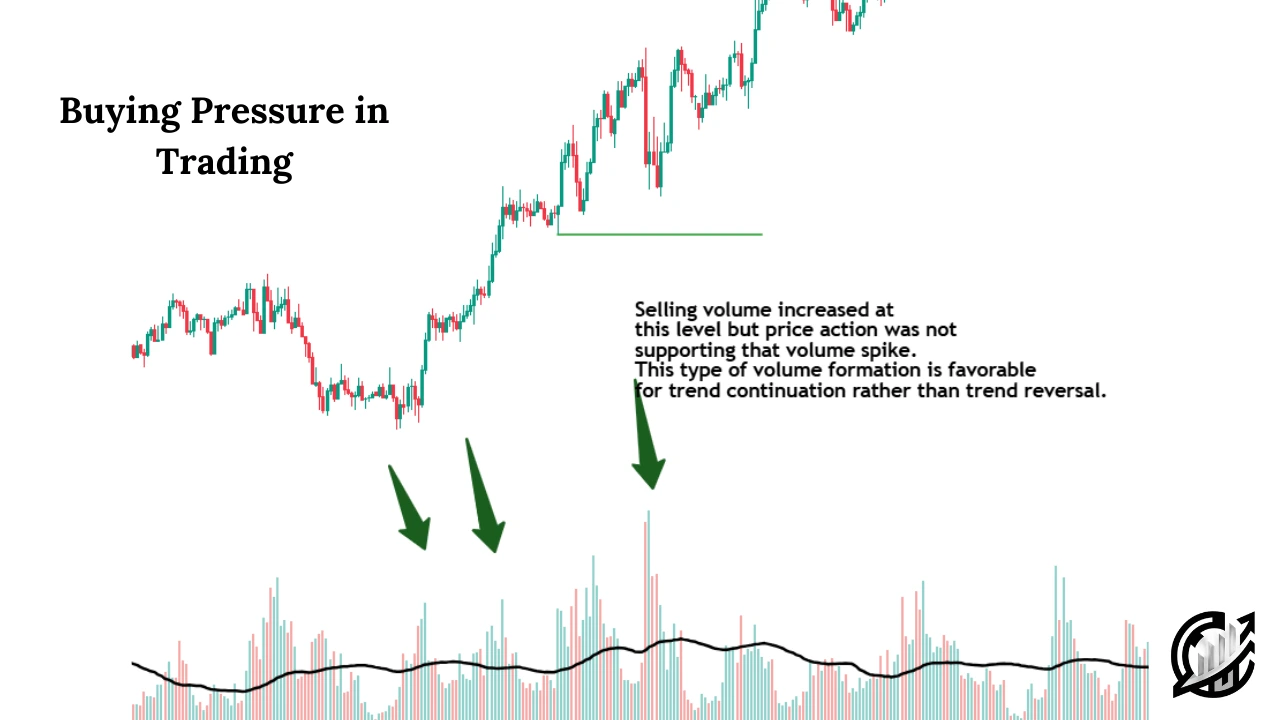
Yes, volume spikes can indicate potential market reversals in day trading. When you see a significant increase in volume, it often signals heightened interest and can precede a change in price direction. For instance, if a stock experiences a surge in volume while approaching a support or resistance level, it may suggest that traders are either buying into a reversal or selling off before a decline. Always confirm with other indicators, like price action or technical signals, for more reliable predictions.
How should I react to unexpected volume spikes?
Reacting to unexpected volume spikes in day trading requires quick assessment and strategic response. First, analyze the reason behind the spike—news releases, earnings reports, or market sentiment shifts can drive volume. If the spike indicates increased interest in a stock, consider entering a position if the trend aligns with your strategy.
Monitor price action closely; a strong breakout with high volume may signal a buying opportunity, while a spike followed by a quick drop could indicate a false breakout. Use stop-loss orders to manage risk effectively. Always stay disciplined and stick to your trading plan to navigate volatility.
What role does news play in volume spikes?
News triggers volume spikes by creating sudden interest in a stock, leading to increased buying or selling activity. Positive news can drive demand, while negative news can cause panic selling. Traders often interpret these volume spikes as signals for potential price movements, indicating a change in market sentiment. Monitoring news releases helps identify the reasons behind these spikes and informs trading decisions.
How can I distinguish between genuine and false volume spikes?
To distinguish between genuine and false volume spikes in day trading, look for these key indicators:
1. Context: Analyze the overall market trend. A spike in a strong uptrend is more likely genuine.
2. News Catalyst: Check for news or events that might explain the spike. Genuine spikes often correlate with earnings reports, product launches, or significant announcements.
3. Price Movement: Observe the price action accompanying the volume spike. Genuine spikes typically lead to sustained price movement, while false spikes often reverse quickly.
4. Volume Comparison: Compare the current volume to average volume over recent sessions. A spike significantly above average suggests authenticity.
5. Timeframe: Consider the timeframe of the spike. Short-lived spikes in low-volume periods are often false.
6. Order Flow: Monitor the order book for large buy orders. Genuine spikes usually have substantial buying interest.
By focusing on these factors, you can better identify whether a volume spike is genuine or false.
What is the relationship between volume spikes and volatility?
Volume spikes often indicate increased interest or activity in a stock, which can lead to heightened volatility. When a significant number of shares are traded suddenly, it suggests that traders are reacting to news or market events, causing rapid price movements. High volume during spikes can signal strong buying or selling pressure, making it crucial for day traders to interpret these shifts. A volume spike followed by sharp price changes typically signals a potential trend or reversal, while low volume might suggest a lack of conviction in price movements.
How can I incorporate volume spikes into my risk management?
To incorporate volume spikes into your risk management in day trading, first, identify significant volume spikes on your charts. Use these spikes as indicators of potential price movements. Adjust your stop-loss orders closer during high volume to protect against sudden reversals, and widen them when volume is low to give trades more room. Also, consider scaling your position size based on volume; increase your investment during spikes and decrease it when volume is low. Always combine volume analysis with other indicators to confirm entry and exit points.
What tools can help analyze volume spikes in day trading?
To analyze volume spikes in day trading, use these tools:
1. Volume Indicators: Tools like On-Balance Volume (OBV) and Volume Moving Averages help identify trends related to volume changes.
2. Charting Software: Platforms like TradingView or Thinkorswim provide real-time charts with volume overlays for detailed analysis.
3. News Aggregators: Tools like Benzinga or MarketWatch track news that may cause volume spikes, giving context to sudden changes.
4. Level 2 Quotes: Accessing Level 2 data shows real-time bids and asks, helping you gauge market depth and volume activity.
5. Technical Analysis Software: Programs like MetaTrader or NinjaTrader allow custom volume analysis and alerts for significant spikes.
Utilizing these tools can enhance your understanding of volume spikes and improve your trading strategies.
Learn about What tools help with hedging in day trading?
Conclusion about How to Interpret Volume Spikes in Day Trading
Understanding volume spikes is essential for effective day trading, as they can provide insights into potential price movements and market sentiment. By identifying and analyzing these spikes, traders can enhance their strategies, improve risk management, and make informed decisions. Tools and indicators that complement volume analysis can further refine your approach. Stay alert to news events that may trigger spikes, and differentiate between genuine and false signals to navigate volatility effectively. For comprehensive guidance on incorporating volume analysis into your trading routine, consider exploring resources from DayTradingBusiness.
Learn about How to Interpret Backtesting Results for Day Trading