Did you know that the volume of trades in a day can sometimes rival the population of a small country? In the world of day trading, understanding volume trends is crucial for developing effective strategies and making informed decisions. This article dives deep into the significance of volume trends, exploring their impact on trading strategies, the importance of volume analysis, and the indicators that can help traders identify key patterns. We’ll also discuss how to spot volume spikes, interpret trends using candlestick charts, and recognize the influence of news on trading volume. With insights on best practices, common mistakes, and the relationship between volume and liquidity, DayTradingBusiness equips you with the essential knowledge to navigate the dynamic trading landscape effectively.
What are volume trends in day trading?
Volume trends in day trading refer to the changes in the number of shares or contracts traded over a specific timeframe. Key trends include increasing volume, indicating strong interest and potential price movement, and decreasing volume, suggesting a lack of conviction. Traders often look for volume spikes as signals for entry or exit points, especially during breakouts or reversals. Analyzing volume alongside price movements helps confirm trends and enhances decision-making.
How do volume trends affect day trading strategies?
Volume trends significantly impact day trading strategies by indicating the strength of price movements. High volume often confirms trends, signaling traders to enter or exit positions. Conversely, low volume may suggest weak price action, leading to cautious trading or avoiding trades altogether. Traders use volume spikes to identify breakout opportunities or reversals, adjusting their strategies based on whether volume aligns with price movements. Monitoring volume can also help in setting stop-loss orders, as increased volume can lead to more volatility.
Why is volume analysis important for day traders?
Volume analysis is crucial for day traders because it indicates the strength of price movements. High volume often confirms trends, helping traders make informed decisions about entry and exit points. It also reveals potential reversals; low volume may signal a lack of conviction in price changes. By analyzing volume trends, day traders can better gauge market interest and volatility, improving their chances of profitability.
What indicators can help analyze volume trends?
To analyze volume trends in day trading, focus on these indicators:
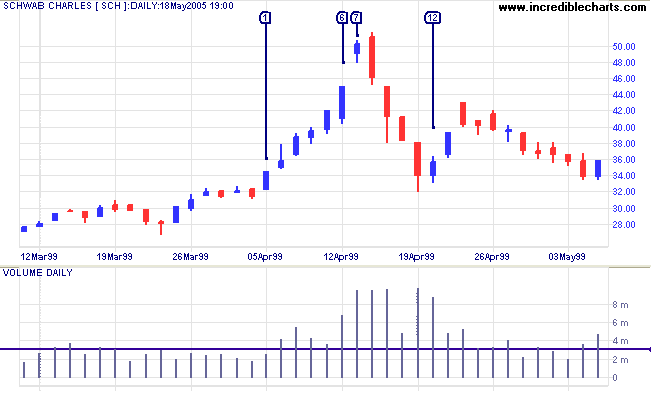
1. Volume Bars: Examine daily volume bars on charts to spot spikes or drops in trading activity.
2. Moving Averages: Use volume moving averages (e.g., 20-day) to identify trends by smoothing out daily fluctuations.
3. On-Balance Volume (OBV): This indicator correlates volume with price movement, showing buying or selling pressure.
4. Accumulation/Distribution Line: This helps identify whether a stock is being accumulated (purchased) or distributed (sold).
5. Chaikin Money Flow (CMF): This combines price and volume to assess the buying and selling pressure over a set period.
6. Relative Volume (RVOL): Compare current volume to average volume over a specific timeframe to gauge unusual activity.
7. Volume Percentage Change: Look for percentage changes in volume compared to previous periods to identify significant shifts.
Using these indicators can enhance your understanding of volume trends and inform your trading decisions.
How can I identify volume spikes in day trading?
To identify volume spikes in day trading, monitor real-time volume data on your trading platform. Look for sudden increases in volume compared to the average over a specific period, like the last 5 or 10 minutes. Use technical indicators such as the Volume Moving Average to spot deviations. Additionally, pay attention to news events or earnings reports that could cause abrupt changes in trading activity. Setting alerts for unusual volume can also help you act quickly when spikes occur.
What role does volume play in price movement?
Volume indicates the number of shares traded and is crucial in price movement analysis. High volume often confirms price trends; for example, if a stock rises on high volume, it suggests strong buying interest. Conversely, low volume during a price increase may signal weakness or a potential reversal. In day trading, traders look for volume spikes to identify opportunities, as significant movements often accompany increased volume. Overall, volume provides context for price changes, helping traders gauge the strength of trends or reversals.
How do I interpret volume trends with candlestick charts?
To interpret volume trends with candlestick charts, look for the relationship between price movement and volume.
1. Rising Volume with Price Increase: Indicates strong buying interest and confirms an uptrend.
2. Rising Volume with Price Decrease: Suggests strong selling pressure, confirming a downtrend.
3. Declining Volume with Price Increase: Signals weakening momentum; a potential reversal might occur.
4. Declining Volume with Price Decrease: Indicates a lack of selling interest, suggesting the trend may soon reverse or consolidate.
Always compare volume spikes against recent averages to assess significance. Use these insights to make informed trading decisions.
What are the common volume patterns to watch for?
Common volume patterns to watch for in day trading include:
1. Increased Volume on Breakouts: A surge in volume when the price breaks resistance or support indicates strong momentum.
2. Volume Spikes: Sudden, sharp increases in volume can signal potential reversals or continuations.
3. Volume Drying Up: A decrease in volume often precedes price consolidation or a potential reversal.
4. High Volume on Pullbacks: If a stock pulls back on high volume, it might suggest that sellers are in control, while low volume on pullbacks indicates weak selling pressure.
5. Volume Moving Averages: Watching volume against its moving average helps identify trends; a crossover can signal a change in market sentiment.
6. Divergence: When price moves in one direction but volume moves in another, it can indicate a potential trend reversal.
Focusing on these patterns can enhance trading strategies and improve decision-making.
How can news impact volume trends in day trading?
News can significantly impact volume trends in day trading by triggering rapid buy or sell reactions. When major news breaks, such as earnings reports, economic data, or geopolitical events, traders respond quickly, causing spikes in trading volume. Positive news often leads to increased buying, while negative news can trigger selling, both of which enhance volume. Additionally, news can create volatility, attracting more traders who seek to capitalize on price movements, further amplifying volume trends.
What are the best practices for using volume in trading?
Use volume as a confirmation tool for price movements. Look for high volume during breakouts to validate trends. Monitor volume spikes; they can indicate potential reversals or continuation. Analyze volume patterns alongside price action for better insight. Use volume indicators like the On-Balance Volume (OBV) or Volume Weighted Average Price (VWAP) to enhance your strategy. Always consider the context: compare current volume to historical averages to gauge significance. Finally, combine volume analysis with other technical indicators for more informed trading decisions.
Learn about What Are the Best Practices for Using AI in Day Trading?
How do volume trends differ between stocks and cryptocurrencies?
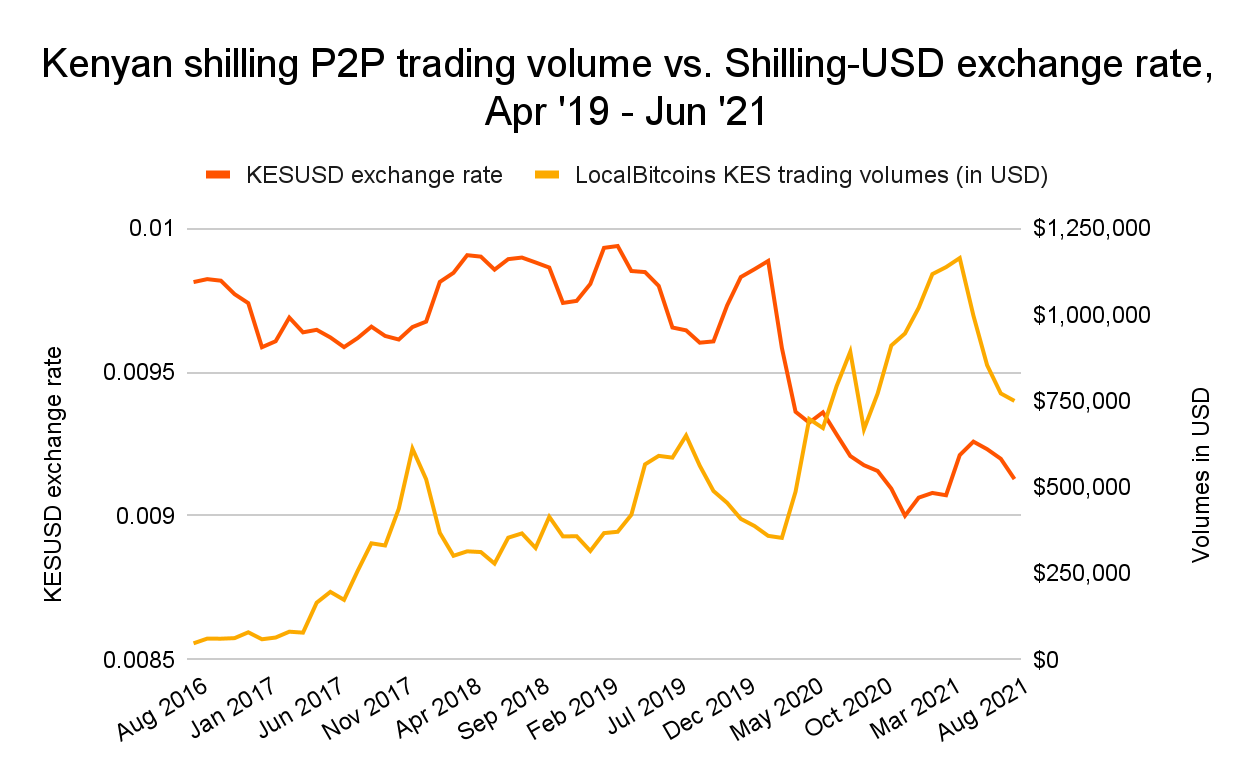
Volume trends in stocks typically show steadiness during market hours, influenced by market news and earnings reports. In contrast, cryptocurrencies often exhibit high volatility and can experience dramatic volume spikes at any time due to market sentiment, regulatory news, or social media trends. Stocks generally have more consistent patterns, while cryptocurrency volume can be erratic, reflecting its speculative nature. Additionally, stocks are subject to trading hours, limiting volume activity, whereas cryptocurrencies trade 24/7, leading to more continuous and unpredictable volume fluctuations.
What tools can assist in tracking volume trends?
Tools that can assist in tracking volume trends in day trading include:
1. Trading Platforms: Most platforms like Thinkorswim or TradeStation offer built-in volume indicators.
2. Charting Software: Software like TradingView provides customizable volume charts and overlays.
3. Volume Indicators: Use specific indicators like On-Balance Volume (OBV) or Volume Weighted Average Price (VWAP) to analyze trends.
4. News Aggregators: Tools like Benzinga or MarketWatch can provide insights into volume spikes related to news events.
5. Stock Scanners: Services like Finviz or Trade Ideas can filter stocks based on volume criteria.
6. API Services: For advanced users, APIs like Alpha Vantage or IEX Cloud can provide volume data for custom analysis.
These tools will enhance your ability to spot volume trends effectively.
How can I use volume to confirm trading signals?
To confirm trading signals using volume, look for these key points:
1. Increased Volume on Breakouts: When a price breaks above resistance or below support, strong confirmation comes from high volume. This indicates strong interest and commitment to the move.
2. Volume Divergence: If a price trend continues but volume decreases, it may signal a weakening trend. Conversely, rising volume during a price increase suggests strength.
3. Volume Patterns: Identify patterns like volume spikes that coincide with price changes. A sudden increase in volume can indicate a potential reversal or continuation.
4. Volume and Candlestick Patterns: Combine volume analysis with candlestick patterns. For instance, a bullish engulfing pattern with high volume reinforces the buying signal.
5. Moving Average of Volume: Use a moving average to smooth out volume spikes. If current volume exceeds the moving average, it adds validity to the trading signal.
By integrating these volume analysis techniques, you can enhance the reliability of your trading signals.
Learn about How to Use AI for Day Trading Signals?
What mistakes should I avoid when analyzing volume trends?
Avoid these mistakes when analyzing volume trends in day trading:
1. Ignoring context: Always consider the broader market conditions and news that could influence volume spikes.
2. Focusing solely on volume: Don’t overlook price action; volume should complement price analysis, not replace it.
3. Neglecting historical comparisons: Compare current volume with past trends to gauge significance.
4. Misinterpreting low volume: Low volume doesn’t always mean a lack of interest; it may indicate consolidation or buildup.
5. Overreacting to brief spikes: Assess whether volume changes are sustained or just temporary noise.
6. Not using multiple time frames: Analyze volume across different time frames for a complete picture.
7. Forgetting about liquidity: Ensure that volume trends align with liquidity levels to avoid slippage.
By avoiding these mistakes, you'll enhance your volume trend analysis in day trading.
How does liquidity relate to volume in day trading?
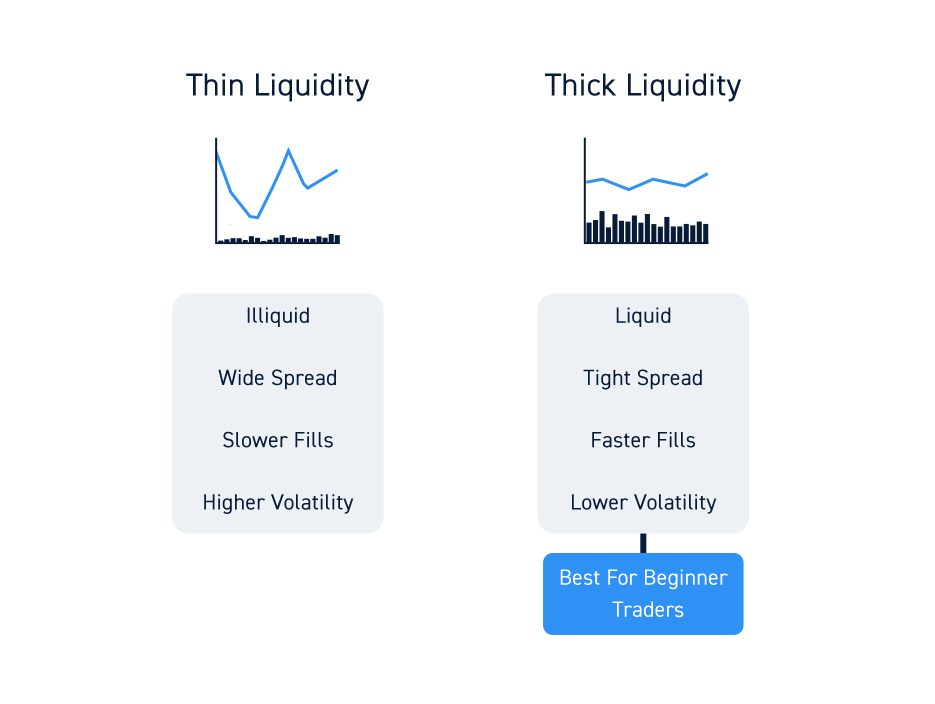
Liquidity refers to how easily an asset can be bought or sold in the market without affecting its price. In day trading, high volume indicates that many shares are being traded, which often correlates with higher liquidity. When volume is high, traders can enter and exit positions quickly, minimizing slippage and reducing the risk of price manipulation. Therefore, strong volume usually enhances liquidity, making it easier for day traders to execute their strategies effectively.
Learn about How Do Market Makers and Liquidity Providers Affect Day Trading?
What is the relationship between volume and volatility?
Volume and volatility are closely linked in day trading. Higher volume often indicates increased interest in a stock, which can lead to greater price fluctuations—this is volatility. When many traders buy or sell a stock, it can cause rapid price changes. Conversely, low volume might result in less volatility, as fewer trades mean smaller price movements. Analyzing volume trends helps traders anticipate potential price swings and make informed decisions.
Conclusion about Analyzing Volume Trends in Day Trading
In conclusion, understanding volume trends is essential for effective day trading. Analyzing volume can enhance your trading strategies by confirming signals, identifying potential price movements, and recognizing key patterns. By leveraging tools and practices tailored to volume analysis, you can make more informed trading decisions. Remember, DayTradingBusiness is here to support you with in-depth insights and resources to navigate the complexities of volume trends in your trading journey.
Learn about Day Trading Stocks: Analyzing Market Trends
Sources:
- Recent trends in trading activity and market quality - ScienceDirect
- Enhancing stock market trend reversal prediction using feature ...
- Daily Return Volatility, Bid-Ask Spreads, and Information Flow ...
- Measuring Liquidity in Financial Markets
- Asymmetric information and the distribution of trading volume ...