Did you know that even a goldfish has a better attention span than most traders? In the fast-paced world of day trading, mastering analysis techniques is crucial for success. This article explores the best analysis methods, including technical, fundamental, sentiment, and quantitative analysis, and how to effectively combine them. We’ll discuss the importance of risk management, the integration of chart patterns and indicators, and the role of price action analysis. Additionally, we’ll delve into tools for combining these methods, the significance of backtesting, and the advantages of a holistic approach. Learn how to avoid common pitfalls and adapt your strategies based on market conditions—all with insights from DayTradingBusiness.
What are the best analysis methods for day trading?
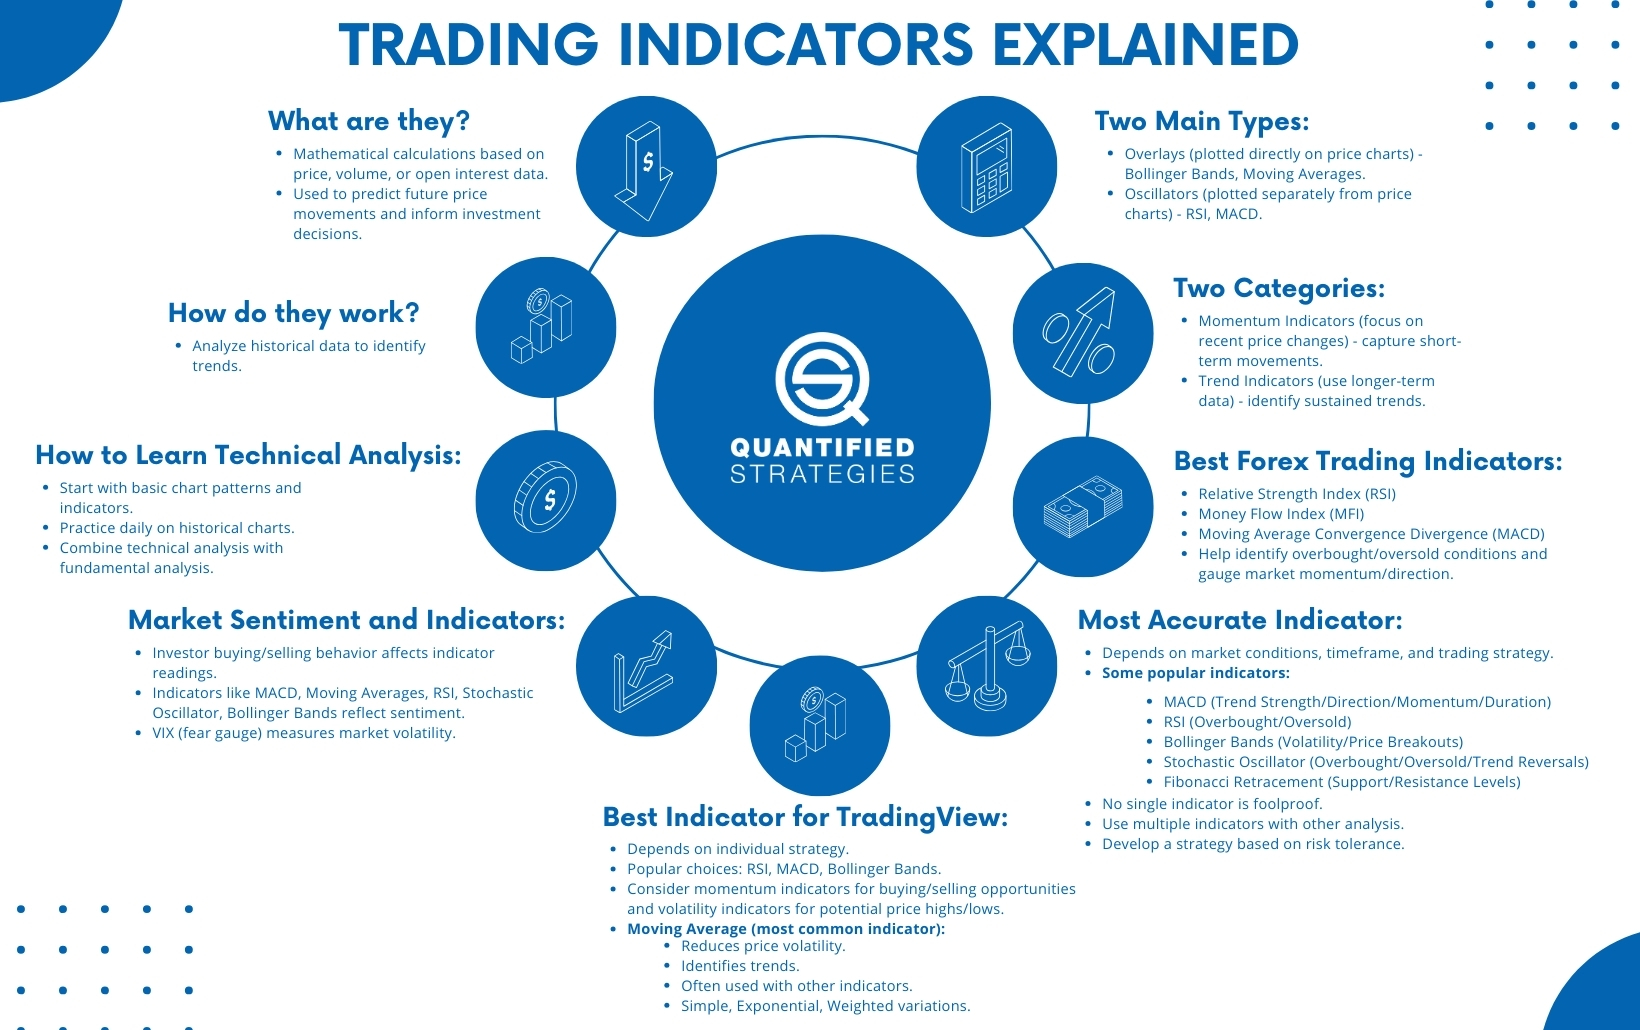
The best analysis methods for day trading include technical analysis, fundamental analysis, and sentiment analysis.
1. Technical Analysis: Use charts, indicators (like moving averages, RSI, and MACD), and price patterns to identify entry and exit points.
2. Fundamental Analysis: Monitor news, earnings reports, and economic indicators to gauge market sentiment and potential price movements.
3. Sentiment Analysis: Analyze social media, news sentiment, and market trends to understand trader psychology and market direction.
Combine these methods for a robust strategy: use technical analysis for timing trades, fundamental analysis for context, and sentiment analysis for market mood. This multi-faceted approach enhances decision-making and improves your chances of success in day trading.
How can I combine technical and fundamental analysis in day trading?
To combine technical and fundamental analysis in day trading, start by using fundamental analysis to identify stocks with strong news catalysts, earnings reports, or economic indicators that could influence price movements. Once you've identified these stocks, apply technical analysis to find optimal entry and exit points using charts, indicators, and patterns.
1. Identify Catalysts: Look for earnings releases, news announcements, or economic data that could impact a stock's price.
2. Use Technical Indicators: Apply indicators like moving averages, RSI, or MACD to assess momentum and trend direction.
3. Set Up Charts: Use candlestick charts to visualize price action and patterns that align with your fundamental insights.
4. Monitor Volume: Check trading volume to confirm the strength of price movements related to your fundamental findings.
5. Risk Management: Always set stop-loss orders based on technical levels to protect against adverse moves.
By integrating both analyses, you can make informed trading decisions that leverage both market sentiment and price action.
What role does sentiment analysis play in day trading strategies?
Sentiment analysis helps day traders gauge market mood by analyzing news, social media, and forums. This insight can inform buy or sell decisions based on market trends and trader emotions. By combining sentiment analysis with technical indicators, traders can enhance their strategies, identifying potential price movements before they occur. For example, a surge in positive sentiment around a stock might signal a good entry point, while negative sentiment could suggest an exit.
How do I use chart patterns alongside indicators in day trading?
To use chart patterns alongside indicators in day trading, first identify key chart patterns like head and shoulders or triangles. Once you spot a pattern, confirm it with indicators such as RSI or MACD to validate potential entry and exit points. For example, if you see a bullish flag pattern, check if the RSI is below 30 and starting to turn up for added confirmation. Use moving averages to identify trends, ensuring your trades align with market momentum. Always set stop-loss orders to manage risk effectively.
What are effective ways to integrate quantitative analysis in day trading?
Use technical indicators like moving averages and RSI to identify trends. Combine these with volume analysis to confirm signals. Set clear entry and exit points based on historical price data and backtesting results. Implement risk management strategies, such as stop-loss orders, to minimize losses. Analyze market news and events quantitatively to gauge potential volatility. Regularly review and adjust your strategies based on performance metrics.
How can I apply price action analysis with other methods?

To apply price action analysis with other methods in day trading, start by integrating technical indicators like moving averages or RSI to confirm price movements. Use price action to identify key support and resistance levels, then cross-reference these with fundamental analysis for potential news impacts. Combine candlestick patterns with volume analysis to assess market sentiment. Additionally, apply trend lines and chart patterns alongside price action signals to enhance your entry and exit strategies. This multi-faceted approach can improve your trading accuracy and decision-making.
What is the importance of risk management in combined analysis techniques?
Risk management in combined analysis techniques is crucial because it helps traders minimize potential losses while maximizing gains. By integrating various analysis methods, such as technical and fundamental analysis, traders can identify more accurate entry and exit points. Effective risk management strategies, like setting stop-loss orders and position sizing, ensure that traders can protect their capital even when market conditions are volatile. This balance allows for better decision-making and enhances overall trading performance in day trading.
How do I create a multi-faceted trading strategy using different analyses?
To create a multi-faceted trading strategy, combine technical analysis, fundamental analysis, and sentiment analysis.
1. Technical Analysis: Use chart patterns, indicators (like RSI or MACD), and support/resistance levels to identify entry and exit points.
2. Fundamental Analysis: Monitor economic news, earnings reports, and market trends to gauge potential price movements. For example, track how a company's earnings affect its stock price.
3. Sentiment Analysis: Assess market sentiment through news articles, social media, and trader surveys. This helps understand the emotional climate around a stock.
4. Integration: Align your technical signals with fundamental insights. For instance, if technical indicators suggest a buy, confirm it with positive earnings forecasts.
5. Risk Management: Set stop-loss orders based on your analysis to minimize losses. Always assess the risk-reward ratio before entering a trade.
By blending these approaches, you can create a more robust and adaptable trading strategy.
What tools can help me combine various analysis methods in day trading?
To combine various analysis methods in day trading, consider these tools:
1. TradingView: Offers advanced charting capabilities with a wide range of indicators for technical analysis, plus the ability to integrate news feeds and fundamentals.
2. MetaTrader 4/5: Provides technical analysis tools, automated trading, and the ability to script custom indicators, enabling a blend of technical and algorithmic approaches.
3. Thinkorswim: Features comprehensive charting tools and allows for integration of fundamental analysis with technical indicators, perfect for holistic strategies.
4. StockCharts: Great for technical analysis with customizable charts and overlays, helping you to visualize different data points together.
5. QuantConnect: If you're into algorithmic trading, this platform lets you backtest and combine various strategies, including technical and statistical methods.
6. Bloomberg Terminal: While pricey, it offers extensive data and analytics, allowing you to integrate multiple analysis methods in real-time.
Select a tool that fits your analysis style and trading strategy for the best results.
How can I evaluate the effectiveness of combined analysis techniques?

To evaluate the effectiveness of combined analysis techniques in day trading, follow these steps:
1. Define Objectives: Clearly what you aim to achieve with the combination, such as improved accuracy or reduced risk.
2. Select Metrics: Use metrics like win rate, risk-reward ratio, and overall profitability to measure effectiveness.
3. Backtesting: Apply the combined techniques to historical data. Analyze performance over various market conditions.
4. Real-time Testing: Implement the combined strategies in live trading with a small capital to gauge real-world effectiveness.
5. Adjust & Optimize: Continuously monitor results. Adjust techniques based on performance data to enhance effectiveness.
6. Review & Analyze: Regularly review trades to identify strengths and weaknesses in your combined approach.
By systematically applying these steps, you can effectively evaluate the performance of your combined analysis techniques in day trading.
What are common pitfalls when integrating different analysis methods?
Common pitfalls when integrating different analysis methods in day trading include:
1. Overcomplication: Combining too many methods can lead to confusion and indecision.
2. Inconsistent Signals: Different analysis techniques may generate conflicting signals, making it hard to take action.
3. Neglecting Market Context: Focusing solely on technical or fundamental analysis without considering market conditions can result in poor decisions.
4. Ignoring Risk Management: Failing to apply consistent risk management across methods can lead to significant losses.
5. Data Overload: Too much information can overwhelm traders, causing analysis paralysis.
6. Time Misalignment: Using methods based on different time frames can create conflicting strategies.
Avoiding these pitfalls requires a clear strategy, consistent criteria for trade decisions, and an understanding of how each method complements the others.
How does backtesting help in combining analysis techniques for day trading?
Backtesting helps in combining analysis techniques for day trading by allowing traders to test various strategies using historical data. It reveals which combinations of technical indicators, chart patterns, and fundamental factors perform best together. By analyzing past trades, traders can identify strengths and weaknesses in their approach, refine their strategies, and increase the likelihood of success in real-time trading. This empirical evidence supports more informed decision-making, ensuring that the blended techniques align with market behavior.
Learn about How to Conduct Fundamental Analysis for Day Trading?
What are the benefits of using a holistic approach to day trading analysis?
A holistic approach to day trading analysis offers several benefits. First, it integrates multiple analysis methods—technical, fundamental, and sentiment analysis—providing a comprehensive view of the market. This leads to better-informed decisions, as traders can identify trends and reversals more accurately.
Second, it enhances risk management by considering various factors that might impact price movements, reducing the likelihood of unexpected losses. Third, combining different techniques helps traders adapt to changing market conditions, improving flexibility and responsiveness.
Finally, it fosters a deeper understanding of market psychology, allowing traders to anticipate potential market reactions more effectively. Overall, a holistic approach increases the chances of successful trades and helps develop a more robust trading strategy.
How can I leverage machine learning with traditional analysis methods?
To leverage machine learning with traditional analysis methods in day trading, start by integrating machine learning models with technical indicators like moving averages or RSI. Use machine learning algorithms to analyze historical price data and identify patterns that traditional methods might miss. For example, combine logistic regression or decision trees with fundamental analysis to predict stock movements based on both numerical data and qualitative factors. Additionally, use machine learning for risk management by training models on past trades to enhance stop-loss strategies. Finally, continuously refine your models with new data to improve accuracy and adapt to market changes.
What indicators work best when combining analysis methods in day trading?
When combining analysis methods in day trading, key indicators include:
1. Moving Averages: Use short-term and long-term averages to identify trends.
2. Relative Strength Index (RSI): Helps determine overbought or oversold conditions.
3. MACD (Moving Average Convergence Divergence): Signals potential buy or sell opportunities based on momentum.
4. Bollinger Bands: Indicate volatility and potential price reversals.
5. Volume: Confirms trends and the strength of price movements.
Integrating these indicators can enhance decision-making by providing a clearer market picture. For example, a crossover in moving averages combined with a favorable RSI can signal a strong entry point.
Learn about Best methods to hedge risk in day trading?
How do I adapt my strategies based on market conditions using combined analysis?
To adapt your day trading strategies based on market conditions using combined analysis, follow these steps:
1. Use Technical and Fundamental Analysis: Start with technical indicators like moving averages and RSI to identify trends. Pair this with fundamental analysis to understand market sentiment and news impacts.
2. Integrate Quantitative Analysis: Analyze historical data to identify patterns and correlations. Use statistical tools to determine the likelihood of price movements based on past behaviors.
3. Employ Sentiment Analysis: Monitor social media and news sentiment to gauge trader emotions. Combine this with technical signals to adjust your entry and exit points.
4. Adapt to Market Volatility: In volatile conditions, consider tighter stop-loss orders and smaller position sizes. When the market stabilizes, you can increase your positions and risk tolerance.
5. Backtest Combined Strategies: Test your combined analysis approach on historical data. This helps refine your strategy and adapt to different market scenarios.
6. Continuous Monitoring: Stay flexible and adjust your strategies in real-time as new data comes in, ensuring you respond quickly to changing market conditions.
By blending these analysis methods, you can create a more robust trading strategy that adapts effectively to market dynamics.
Learn about How Market Conditions Affect HFT Strategies
Conclusion about Techniques for Combining Different Analysis Methods in Day Trading
Incorporating various analysis methods is crucial for enhancing your day trading strategies. By blending technical, fundamental, sentiment, and quantitative analyses, traders can gain a more comprehensive market perspective. Utilizing tools for integration, practicing risk management, and adapting to market conditions significantly improve decision-making. As you explore these techniques, remember that a holistic approach can lead to better outcomes. For additional insights and guidance, DayTradingBusiness is here to support your trading journey.
Learn about Volume Analysis for Different Markets in Day Trading
Sources:
- A method for automatic stock trading combining technical analysis ...
- A novel optimization method combining metaheuristics and machine ...
- Electricity price forecasting by a hybrid model, combining wavelet ...
- Oil price volatility prediction using out-of-sample analysis ...
- Data vs. information: Using clustering techniques to enhance stock ...