Did you know that the average day trader spends more time analyzing charts than some people spend watching Netflix? In the fast-paced world of day trading, understanding technical analysis is crucial for making informed decisions. This article dives into what day trading technical analysis is, how it functions, and the key indicators you need to know. Explore the importance of charts, candlestick patterns, and support and resistance levels, as well as how to identify trends and the role of volume in your trading strategy. We’ll also cover common pitfalls to avoid, tools to enhance your analysis, and the impact of news events. By the end, you’ll have a solid foundation to develop effective day trading strategies using technical analysis, brought to you by DayTradingBusiness.
What is Day Trading Technical Analysis?
Day trading technical analysis involves analyzing price charts and indicators to make short-term trading decisions. Traders use tools like moving averages, volume, and oscillators to predict price movements within a single trading day. The goal is to identify entry and exit points for trades based on patterns and trends in the market.
How Does Technical Analysis Work in Day Trading?
Technical analysis in day trading involves using charts and historical price data to identify trends and make trading decisions. Traders analyze patterns, indicators, and volume to predict future price movements. Key tools include moving averages, relative strength index (RSI), and candlestick patterns. By assessing these elements, traders aim to enter and exit positions quickly, capitalizing on short-term market fluctuations. The goal is to maximize profits while managing risks effectively.
What Are the Key Indicators in Day Trading Technical Analysis?
Key indicators in day trading technical analysis include:
1. Moving Averages: Help identify trends by smoothing price data.
2. Relative Strength Index (RSI): Measures overbought or oversold conditions.
3. MACD (Moving Average Convergence Divergence): Indicates momentum and potential reversals.
4. Bollinger Bands: Show volatility and potential price breakouts.
5. Volume: Confirms trends and signals strength or weakness.
6. Candlestick Patterns: Reveal market sentiment and potential reversals.
These indicators assist traders in making informed decisions quickly.
How Can I Use Charts for Day Trading Technical Analysis?
Use charts in day trading technical analysis by focusing on price action, trends, and patterns. Start with candlestick charts to visualize price movements. Identify key support and resistance levels, which indicate where prices may reverse or continue. Use indicators like moving averages, RSI, or MACD to gauge momentum and potential entry or exit points. Analyze chart patterns, such as head and shoulders or triangles, to anticipate future price movements. Finally, combine these insights with volume analysis to confirm trends and make informed trading decisions.
What Is the Role of Candlestick Patterns in Day Trading?
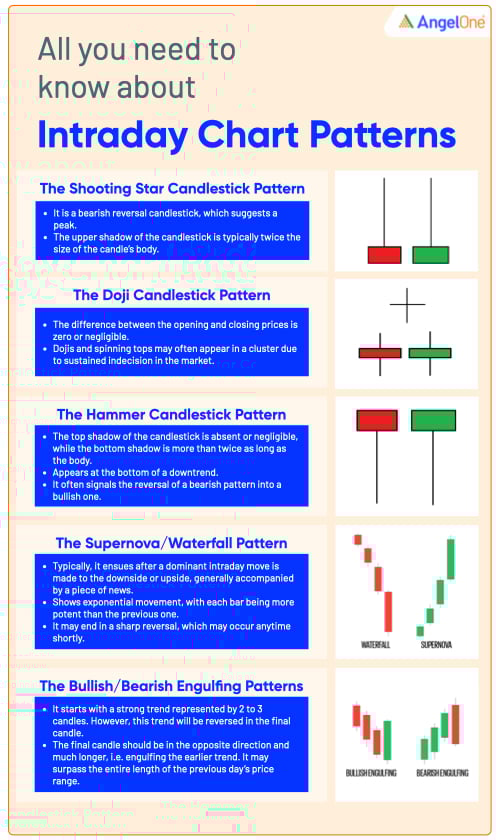
Candlestick patterns are essential in day trading technical analysis as they provide visual cues about price movements and potential market reversals. Traders use these patterns to make quick decisions based on market sentiment. For example, a bullish engulfing pattern may signal a buying opportunity, while a bearish engulfing pattern could indicate a sell signal. Understanding these patterns helps traders gauge momentum and refine their entry and exit points, ultimately improving their trading strategies.
How Do Support and Resistance Levels Affect Day Trading?
Support and resistance levels are crucial in day trading technical analysis. They indicate price points where a stock tends to reverse direction. Traders use these levels to make entry and exit decisions. If the price approaches a support level, it may bounce back up, presenting a buying opportunity. Conversely, if it nears a resistance level, it might drop, signaling a selling opportunity. Identifying these levels helps traders manage risk and improve their chances of profitable trades. Understanding how they interact with price movements can enhance decision-making in fast-paced trading environments.
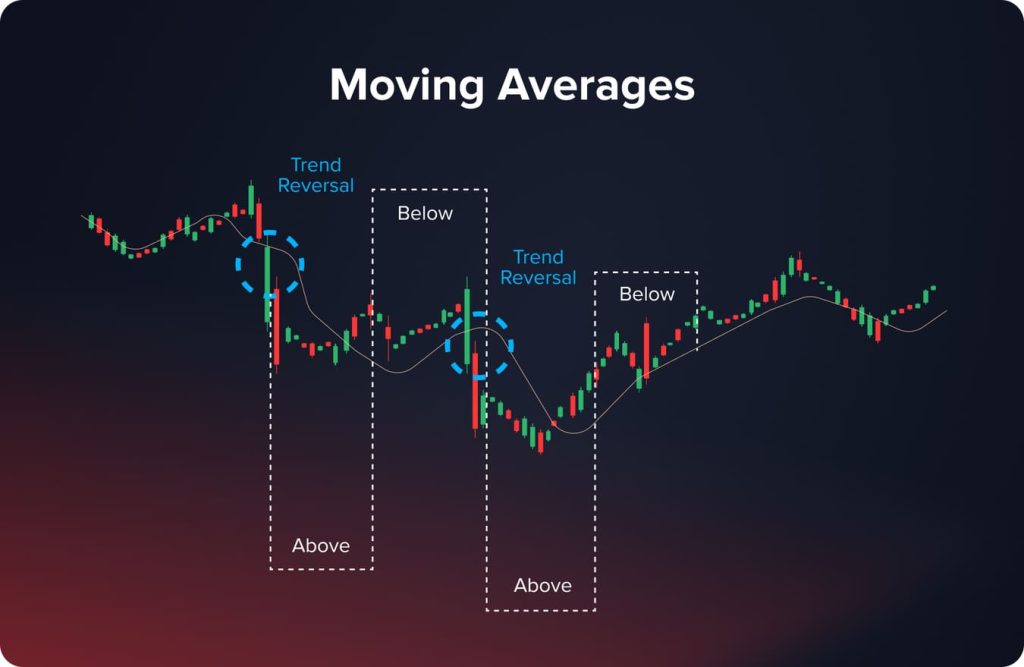
What Are Moving Averages and How Are They Used in Day Trading?
Moving averages are indicators that smooth out price data to identify trends over a specific period. In day trading, they help traders determine entry and exit points by highlighting potential support or resistance levels.
Traders often use short-term moving averages, like the 10-day or 20-day, to spot quick price movements. When the price crosses above a moving average, it can signal a buying opportunity, while a drop below may indicate a sell signal.
Combining moving averages with other indicators, like the RSI or MACD, can enhance trading strategies by confirming trends and momentum.
How Can I Identify Trends in Day Trading Technical Analysis?
To identify trends in day trading technical analysis, follow these steps:
1. Use Moving Averages: Apply short-term moving averages (like the 5-day or 10-day) to spot upward or downward trends.
2. Analyze Chart Patterns: Look for common patterns, such as head and shoulders, flags, or triangles, which indicate potential trend reversals or continuations.
3. Check Trend Lines: Draw trend lines on price charts to visualize upward or downward movements. A series of higher highs indicates an uptrend; lower lows indicate a downtrend.
4. Monitor Volume: Observe trading volume alongside price movements. Increasing volume on a price rise confirms a strong trend, while declining volume may signal weakness.
5. Use Indicators: Employ indicators like the Relative Strength Index (RSI) or MACD to measure momentum and identify overbought or oversold conditions.
6. Stay Updated: Follow news and economic indicators that may affect market sentiment and trends.
Consistently applying these techniques will enhance your ability to identify trends in day trading.
What Is the Importance of Volume in Day Trading?
Volume is crucial in day trading because it indicates the strength of a price movement. High volume suggests strong interest and confirms trends, making it easier to identify entry and exit points. Low volume can signal a lack of conviction, leading to potential reversals. Traders often use volume alongside price action to validate their technical analysis, ensuring that trades are backed by solid market activity. Understanding volume helps traders make informed decisions and manage risk effectively.
How Do I Choose the Right Technical Indicators for Day Trading?
To choose the right technical indicators for day trading, first identify your trading style and strategy. Common indicators include moving averages for trend direction, RSI for overbought or oversold conditions, and MACD for momentum. Use volume indicators to confirm trends. Test different combinations on a demo account to see what works best for your approach. Keep it simple; too many indicators can lead to confusion. Focus on those that provide clear signals and align with your risk tolerance.
Learn about How to Choose the Right Indicators for Day Trading
What Are Common Mistakes in Day Trading Technical Analysis?
Common mistakes in day trading technical analysis include:
1. Over-reliance on indicators: Many traders depend too much on technical indicators without considering market context or price action.
2. Ignoring trends: Failing to identify or follow the overall trend can lead to poor trade decisions.
3. Lack of a trading plan: Trading without a clear strategy often results in impulsive decisions and losses.
4. Neglecting risk management: Not setting stop-loss orders or risking too much capital on a single trade can lead to significant losses.
5. Overtrading: Taking too many trades can dilute focus and increase transaction costs, leading to poor performance.
6. Confirmation bias: Seeking only information that supports a preconceived notion can cloud judgment.
7. Emotional trading: Letting fear or greed dictate actions often results in missed opportunities or poor executions.
Avoiding these mistakes can enhance effectiveness in day trading using technical analysis.
Learn about Common Mistakes in Day Trading Technical Analysis
How Can I Develop a Day Trading Strategy Using Technical Analysis?
Day trading technical analysis involves using price charts and various indicators to make informed trading decisions. To develop a strategy:
1. Choose Your Market: Focus on stocks, forex, or futures that you understand well.
2. Select Indicators: Use tools like moving averages, RSI, MACD, and Bollinger Bands to identify trends and entry/exit points.
3. Time Frame: Decide on a time frame for trades, typically 1-minute to 15-minute charts.
4. Set Entry and Exit Rules: Define specific criteria for entering and exiting trades based on your indicators.
5. Risk Management: Set stop-loss orders to limit losses and determine position size based on your risk tolerance.
6. Backtesting: Test your strategy with historical data to refine your approach before trading live.
7. Monitor and Adjust: Regularly review your trades and adjust your strategy based on performance and market conditions.
This structured approach can help you create a solid day trading strategy using technical analysis.
Learn about How to Develop a Personal Day Trading Strategy
What Tools and Software Are Best for Day Trading Technical Analysis?
The best tools and software for day trading technical analysis include:
1. TradingView: Offers advanced charting tools and a large community for sharing strategies.
2. MetaTrader 4/5: Widely used for forex trading with customizable indicators and automated trading options.
3. Thinkorswim: An advanced trading platform by TD Ameritrade, providing extensive charting and analysis features.
4. NinjaTrader: Focuses on futures and forex with robust charting and market analysis tools.
5. eSignal: Offers professional-grade charting and technical analysis tools with real-time data.
6. StockCharts: A web-based platform for charting, screening, and analyzing stocks.
Choose based on your specific trading needs and preferences.
Learn about What Are the Best Tools for Day Trading Analysis?
How Do News Events Impact Technical Analysis in Day Trading?
News events significantly impact technical analysis in day trading by causing price volatility and shifts in market sentiment. Traders often adjust their strategies based on breaking news, earnings reports, or economic data releases. This can lead to rapid price movements that technical indicators, like moving averages or RSI, may not fully capture. For example, a positive earnings report can cause a stock to spike, overriding previous technical resistance levels. As a result, day traders must stay informed and be ready to adapt their technical analysis in response to news developments.
Learn about How News Events Impact Day Trading Decisions
What Are the Differences Between Technical and Fundamental Analysis in Day Trading?
Technical analysis in day trading focuses on price movement and volume data to make trading decisions. It uses charts and indicators to identify patterns and trends. Traders rely on tools like moving averages, RSI, and MACD to predict future price movements.
Fundamental analysis, on the other hand, evaluates a security's intrinsic value by examining economic indicators, earnings reports, and news events. Day traders using fundamental analysis look for catalysts that may impact stock prices, such as earnings releases or economic data.
In summary, technical analysis is about price patterns and market trends, while fundamental analysis considers the underlying factors driving price changes.
Learn about What Are the Differences Between Manual and AI Day Trading?
How Can I Improve My Technical Analysis Skills for Day Trading?

To improve your technical analysis skills for day trading, start by mastering the basics of chart patterns, indicators, and trendlines. Practice daily by analyzing charts and identifying key support and resistance levels. Use tools like moving averages, RSI, and MACD to refine your strategies.
Engage in simulated trading to apply your skills without financial risk. Join online forums or communities to share insights and learn from experienced traders. Keep a trading journal to track your decisions and outcomes, helping you identify areas for improvement. Lastly, stay updated with market news as it can influence price movements.
Learn about How to Improve Your Day Trading Analysis Skills
Conclusion about What is Day Trading Technical Analysis?
In conclusion, mastering day trading technical analysis is essential for navigating the fast-paced trading environment. By understanding key indicators, utilizing charts effectively, and recognizing patterns, traders can make informed decisions. Emphasizing support and resistance levels, moving averages, and volume can enhance your strategy significantly. Avoiding common mistakes and leveraging the right tools further solidifies your approach. For comprehensive guidance and resources to refine your skills, DayTradingBusiness is here to support your journey in technical analysis and day trading success.