Did you know that the trading volume of a stock can sometimes be higher than its own market cap? In day trading, understanding volume is crucial for making informed decisions. This article delves into the importance of volume in technical analysis, exploring how it influences price movements and affects key support and resistance levels. We’ll discuss essential volume indicators and how to interpret volume spikes, as well as the relationship between volume, volatility, and market sentiment. Additionally, we’ll highlight common mistakes traders make regarding volume and how to leverage volume analysis to enhance trading strategies. With insights from DayTradingBusiness, you'll be better equipped to navigate the complexities of volume in your day trading endeavors.
What is the importance of volume in day trading?
Volume is crucial in day trading because it indicates the strength of a price movement. High volume often confirms trends, suggesting that many traders support the price direction. Conversely, low volume can signal weak trends and potential reversals. Additionally, volume helps identify key support and resistance levels, guiding entry and exit decisions. Without considering volume, traders may misinterpret price movements, leading to poor trade choices.
How does volume influence price movement in day trading?
Volume influences price movement in day trading by indicating the strength of a price trend. Higher volume often confirms the trend's validity, signaling that many traders support the price movement. Conversely, low volume can suggest a lack of interest, making price movements less reliable. Traders watch volume spikes for potential reversals or breakouts, as these often precede significant price changes. Understanding volume helps day traders make informed decisions about entry and exit points.
What are the key volume indicators used in technical analysis?
Key volume indicators in technical analysis include:
1. Volume: The total number of shares traded during a specific time period. High volume often confirms price movements.
2. On-Balance Volume (OBV): Measures buying and selling pressure by adding volume on up days and subtracting on down days, indicating trend strength.
3. Accumulation/Distribution Line: Combines price and volume to show whether a stock is being accumulated (bought) or distributed (sold), providing insight into market sentiment.
4. Chaikin Money Flow (CMF): Measures the buying and selling pressure over a set period, helping identify potential reversals.
5. Volume Moving Average: Averages volume over a specific timeframe to smooth out spikes and identify trends.
These indicators help traders gauge market strength and make informed decisions.
How can traders interpret volume spikes in day trading?
Traders can interpret volume spikes in day trading as signals of potential price movements. A sudden increase in volume often indicates heightened interest in a stock, which can precede significant price changes. If volume spikes accompany an upward price move, it may suggest strong buying interest, signaling a potential breakout. Conversely, if a volume spike occurs during a price drop, it could indicate panic selling or confirmation of a downtrend. Monitoring volume in relation to price action helps traders validate trends, identify reversals, and make informed entry and exit decisions.
What does low volume signal in day trading?
Low volume in day trading signals a lack of interest or participation in a stock, often indicating weak price movements and potential volatility. When volume is low, price changes may not be reliable, making it harder to predict trends. Traders may interpret low volume as a sign to avoid entering positions, as it can lead to slippage and increased risk.
How does volume affect support and resistance levels?
Volume affects support and resistance levels by confirming the strength of these price points. High volume at a support level suggests strong buying interest, making it likely to hold. Conversely, low volume may indicate weak support, increasing the chance of a breakdown. At resistance, high volume signals strong selling pressure, reinforcing the level. If a price breaks through resistance on high volume, it often indicates a strong trend continuation. Thus, analyzing volume alongside price movements enhances the reliability of support and resistance levels in day trading.
What role does volume play in confirming trends?
Volume confirms trends by indicating the strength of price movements. High volume during an uptrend suggests strong buying interest, while high volume in a downtrend shows significant selling pressure. Low volume can signal a lack of conviction, making trends suspect. In day trading, traders often look for volume spikes to validate breakouts or reversals, as these spikes indicate stronger market participation and increase the likelihood that the trend will continue.
How can volume analysis improve trading strategies?
Volume analysis enhances trading strategies by providing insights into market strength and momentum. High volume during price movements indicates strong interest and confirms trends, while low volume may signal weakness or potential reversals. Day traders can use volume to identify entry and exit points, ensuring they align trades with significant market activity. Additionally, volume patterns can reveal potential support and resistance levels, helping traders make more informed decisions. By integrating volume analysis, traders can refine their strategies, reduce risks, and increase the likelihood of successful trades.
What is the relationship between volume and volatility?
Volume and volatility are closely intertwined in day trading. High volume often precedes increased volatility, indicating strong trader interest and potential price movement. When many shares are traded, it can lead to rapid price changes as supply and demand shift. Conversely, low volume can result in less price fluctuation, making it harder to enter or exit trades effectively. In summary, rising volume typically signals potential volatility, while declining volume suggests stability.
How can traders use volume to identify reversals?
Traders can use volume to identify reversals by looking for significant spikes in trading volume that accompany price movements. A sudden increase in volume during a price drop may indicate a potential reversal to the upside, signaling that buyers are stepping in. Conversely, a volume spike during a price rise could suggest a reversal to the downside, indicating sellers are entering the market.
Additionally, traders often watch for volume patterns, such as divergence, where price moves in one direction while volume trends in the opposite. This can signal weakening momentum and a potential reversal. Combining volume analysis with other indicators, like candlestick patterns or support and resistance levels, enhances the reliability of reversal signals.
Learn about How Do Institutional Traders Use Volume and Order Flow Data?
What are the common mistakes traders make regarding volume?
Traders often make several common mistakes regarding volume in day trading. One major mistake is ignoring volume trends; they focus solely on price movements without considering how volume supports those moves. Another is misinterpreting low volume as a lack of interest, when it can indicate a potential reversal or consolidation. Additionally, many traders fail to differentiate between real volume spikes and false spikes caused by low liquidity. Relying on volume indicators without context can also lead to poor decisions, as traders might not factor in market news or events. Lastly, some traders neglect to analyze volume in relation to the overall market or sector, missing important signals.
How does volume differ between stocks and futures in day trading?
In day trading, volume for stocks typically reflects the number of shares traded, while for futures, it indicates the number of contracts exchanged. Stock volume can fluctuate significantly based on news or earnings reports, whereas futures volume often correlates with market events and economic data releases. Generally, higher volume in both indicates stronger interest, but futures can show more rapid volume changes due to leveraged positions. Traders often use volume alongside price action to identify trends and reversals, making it a crucial aspect of technical analysis in both markets.
What is the significance of average volume in technical analysis?
Average volume in technical analysis indicates the typical amount of shares traded over a specific period, helping traders gauge market activity and liquidity. High average volume often signals strong interest in a stock, suggesting potential price movements. Conversely, low average volume may indicate weak interest, leading to less reliable price changes. Tracking average volume helps day traders confirm trends and make informed decisions about entry and exit points.
How can volume patterns indicate market sentiment?
Volume patterns reveal market sentiment by showing the strength or weakness behind price movements. High volume during an uptrend suggests strong buying interest, indicating bullish sentiment. Conversely, high volume in a downtrend signals strong selling pressure, reflecting bearish sentiment. Low volume during price increases may indicate a lack of conviction, suggesting that the rally could reverse. Analyzing volume spikes can help traders gauge potential reversals or continuations, as increased activity often precedes significant price changes.
What tools can help analyze volume in day trading?
Tools that can help analyze volume in day trading include:
1. Trading Platforms: Most platforms like Thinkorswim, MetaTrader, and Interactive Brokers offer built-in volume indicators.
2. Volume Indicators: Use indicators like On-Balance Volume (OBV), Volume Moving Average, or Chaikin Money Flow to gauge buying and selling pressure.
3. Charting Software: Tools like TradingView and StockCharts allow you to overlay volume bars on price charts for visual analysis.
4. Level II Quotes: This provides real-time data on order book volume, helping you gauge market depth and liquidity.
5. News Aggregators: Services like Benzinga or MarketWatch can provide insights into volume spikes related to news events.
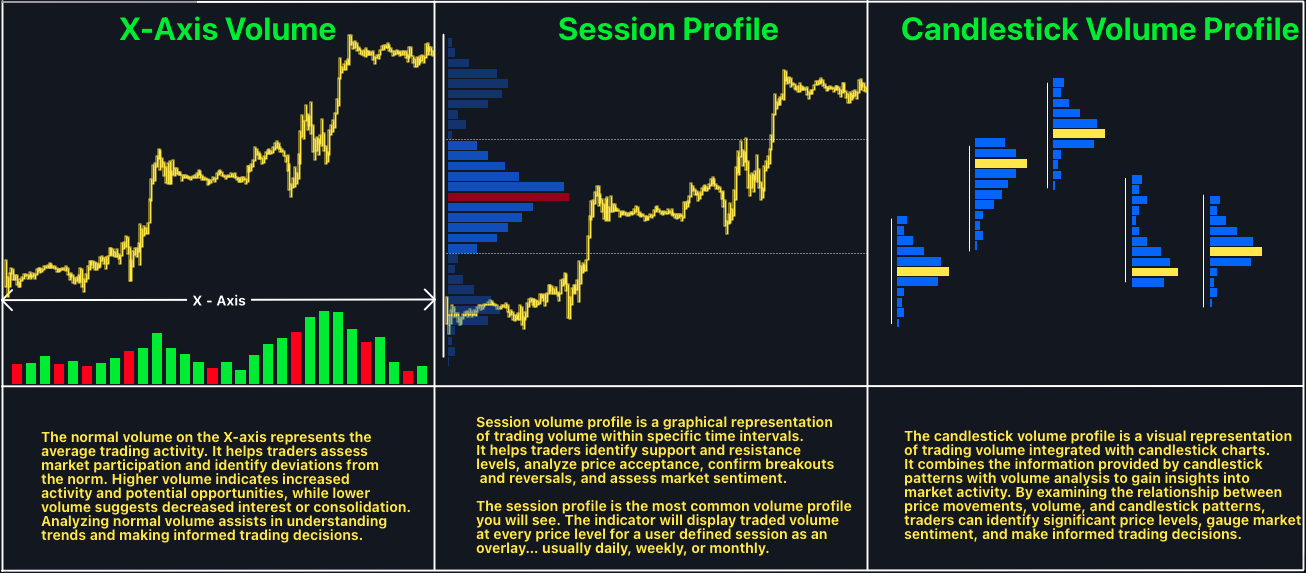
6. Volume Profile Tools: These show volume distribution over price levels, highlighting areas of support and resistance.
Using these tools can enhance your understanding of market dynamics and improve day trading strategies.
Learn about What tools help with hedging in day trading?
How does news impact volume in day trading?
News significantly impacts volume in day trading by triggering rapid price movements and heightened investor interest. When important news breaks, such as earnings reports or economic data, it often leads to increased buying or selling pressure. This surge in activity raises trading volume, indicating strong market sentiment. High volume can confirm trends, making it crucial for traders to monitor news releases closely to identify potential entry and exit points. In summary, news events are key catalysts for volume spikes, influencing day trading strategies and outcomes.
Learn about How Do SEC Rules Impact Day Trading?
Conclusion about The Role of Volume in Day Trading Technical Analysis
Understanding volume is essential for successful day trading, as it directly influences price movement, trend confirmation, and market sentiment. By effectively analyzing volume, traders can refine their strategies, identify potential reversals, and avoid common pitfalls. Tools and indicators tailored for volume analysis can enhance decision-making, ultimately leading to better trading outcomes. For those seeking to deepen their knowledge and skills, DayTradingBusiness offers valuable insights and resources to navigate the complexities of volume in day trading.
Learn about The Role of Volume in Day Trading Chart Analysis