Did you know that 90% of day traders fail, often because they ignore the power of trends? In the world of day trading, understanding trend analysis is essential for success. This article dives into the fundamentals of trend analysis, explaining its significance, the tools required, and how to identify and utilize various trends effectively. You'll learn how trends impact market volatility, the role of time frames, and the best indicators for your trading strategy. Additionally, we’ll explore common pitfalls to avoid and how trend analysis can enhance risk management. With insights from DayTradingBusiness, this guide equips you with the knowledge to make informed trading decisions and improve your overall performance.
What is trend analysis in day trading?
Trend analysis in day trading is the process of evaluating price movements over a specific period to identify patterns and predict future price direction. Traders use charts and indicators to spot upward, downward, or sideways trends, helping them make informed buy or sell decisions. Recognizing trends allows traders to capitalize on short-term price fluctuations, optimizing their entry and exit points for maximum profit.
Why is trend analysis crucial for day traders?
Trend analysis is crucial for day traders because it helps identify potential market movements and entry or exit points. By recognizing upward or downward trends, traders can make informed decisions to maximize profits and minimize losses. It provides insights into market sentiment and the overall direction of stocks, allowing traders to align their strategies accordingly. Without trend analysis, traders risk making impulsive decisions based on emotions rather than data.
How do you identify trends in day trading?
To identify trends in day trading, start by analyzing price charts. Look for clear upward or downward movements, often indicated by higher highs and higher lows for bullish trends, and lower highs and lower lows for bearish trends. Use technical indicators like moving averages, RSI, and MACD to confirm the trend direction. Pay attention to volume; increasing volume often supports the trend. Additionally, check for patterns like flags or triangles that may signal continuation or reversal. Regularly review news and market sentiment, as these can influence trends.
What tools are used for trend analysis in trading?
Tools used for trend analysis in trading include moving averages, trend lines, and the Relative Strength Index (RSI). Charting software like TradingView or MetaTrader provides visual insights. Candlestick patterns and volume analysis also play a key role. Other useful tools are Bollinger Bands and MACD for identifying momentum.
How can trend analysis improve trading decisions?
Trend analysis improves trading decisions by identifying the direction of price movements, allowing traders to capitalize on upward or downward trends. It helps in recognizing patterns, refining entry and exit points, and managing risk effectively. By analyzing historical data, traders can forecast potential future price behaviors, enhancing their ability to make informed, timely trades. This strategic approach increases the likelihood of profitability and reduces emotional decision-making.
What are the common types of trends in day trading?
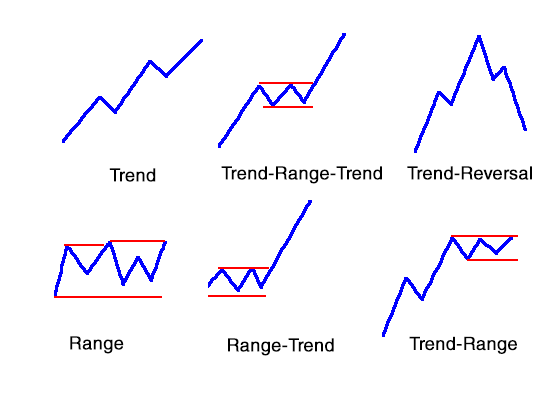
Common types of trends in day trading include:
1. Uptrends: Characterized by rising prices and higher highs, indicating bullish market sentiment.
2. Downtrends: Marked by falling prices and lower lows, reflecting bearish market conditions.
3. Sideways Trends: Prices move within a horizontal range, showing indecision in the market.
4. Reversal Trends: Occur when a prevailing trend changes direction, signaling potential buying or selling opportunities.
5. Continuation Trends: Indicate that a trend is likely to persist after a brief pause or consolidation.
Understanding these trends helps traders make informed decisions based on market behavior.
How does trend analysis differ from technical analysis?
Trend analysis focuses on identifying and evaluating the direction of market movements over time, using historical data to project future price movements. It emphasizes patterns, momentum, and long-term shifts. Technical analysis, on the other hand, involves studying price charts and indicators to make short-term trading decisions, often relying on tools like moving averages and oscillators. While both methods aim to predict market behavior, trend analysis is broader and more about overall direction, whereas technical analysis is detailed and tactical for specific trades.
What indicators are best for trend analysis?
The best indicators for trend analysis in day trading include:
1. Moving Averages: Use the 50-day and 200-day moving averages to identify the overall trend direction.
2. Relative Strength Index (RSI): This momentum oscillator helps determine overbought or oversold conditions, signaling trend strength.
3. MACD (Moving Average Convergence Divergence): Combines moving averages to show trend direction and momentum.
4. Bollinger Bands: These help gauge volatility and potential price reversals within a trend.
5. Average Directional Index (ADX): Measures trend strength, with values above 20 indicating a strong trend.
Using these indicators can help you make informed trading decisions based on current market trends.
How can trends impact market volatility in day trading?
Trends significantly impact market volatility in day trading by influencing price movements and trader behavior. When a trend is established, traders often react quickly, amplifying price swings. Strong upward or downward trends can lead to increased buying or selling pressure, heightening volatility. Conversely, a lack of clear trends can cause uncertainty, resulting in erratic price fluctuations. Day traders rely on trend analysis to make informed decisions, identify entry and exit points, and manage risk effectively, ultimately leveraging volatility for profit.
What role does time frame play in trend analysis?
Time frame is crucial in trend analysis for day trading as it determines the perspective and relevance of price movements. Shorter time frames, like 1-minute or 5-minute charts, highlight immediate trends, helping traders make quick decisions. Conversely, longer time frames, such as hourly or daily charts, reveal broader market trends and can influence risk management strategies. Choosing the right time frame aligns trading strategies with market volatility and improves entry and exit timing. Ultimately, the appropriate time frame enhances the accuracy of trend analysis and trading success.
How do you spot a reversal in a trading trend?
To spot a reversal in a trading trend, look for these key indicators:
1. Price Action: Watch for significant changes in price direction, like double tops or bottoms.
2. Volume: Increased trading volume during a price change can signal strength behind the reversal.
3. Technical Indicators: Use tools like moving averages, RSI, or MACD; a crossover or divergence can indicate a potential reversal.
4. Chart Patterns: Identify patterns like head and shoulders or flags, which often precede trend reversals.
5. Support and Resistance Levels: Breaks of these levels can suggest a shift in market sentiment.
Monitor these elements closely to make informed trading decisions.
Learn about How to Spot Reversal Signals on Day Trading Charts
What mistakes should traders avoid in trend analysis?
Traders should avoid these mistakes in trend analysis:
1. Ignoring multiple timeframes: Don't base decisions solely on one timeframe; analyze trends across different periods for a clearer picture.
2. Overlooking volume: High volume can confirm a trend; low volume might indicate weakness. Always consider volume alongside price movements.
3. Relying on lagging indicators: Avoid using only lagging indicators like moving averages; they can delay your response to trend changes.
4. Failing to adapt: Trends change; don’t cling to outdated analyses. Stay flexible and adjust your strategy as needed.
5. Overtrading: Don’t force trades based on perceived trends; wait for solid signals and confirmations.
6. Neglecting risk management: Always set stop-loss orders based on your analysis to protect against sudden reversals.
7. Misinterpreting trend lines: Ensure your trend lines are drawn correctly and respect them; false breakouts can mislead you.
By avoiding these pitfalls, traders can enhance their trend analysis and make more informed decisions.
How can trend analysis help in risk management?
Trend analysis helps in risk management by identifying patterns in price movements, allowing traders to predict potential market shifts. By recognizing upward or downward trends, traders can make informed decisions about entry and exit points, minimizing losses. It also aids in setting stop-loss levels and adjusting position sizes based on historical performance, thus enhancing overall strategy effectiveness. Understanding trends helps traders anticipate volatility, enabling them to manage their exposure more effectively.
Learn about How Can AI Help in Day Trading Risk Management?
What are the benefits of using trend lines in trading?
Trend lines help traders identify the direction of market movement, making it easier to spot potential entry and exit points. They provide visual representation of support and resistance levels, enhancing decision-making. Trend lines also help in assessing market momentum, allowing traders to gauge the strength of a trend. Additionally, they can filter out noise, focusing attention on significant price movements. Overall, using trend lines in trading improves strategy effectiveness and increases the likelihood of successful trades.
How do market news and events influence trends?
Market news and events significantly influence trends by shifting trader sentiment and altering supply and demand dynamics. For example, positive earnings reports can lead to bullish trends, while geopolitical tensions may trigger bearish movements. Day traders often analyze news releases in real-time to capitalize on rapid price changes. Understanding these influences allows traders to make informed decisions and adjust their strategies quickly, enhancing their chances of success.
Can trend analysis be applied to other trading strategies?

Yes, trend analysis can be applied to various trading strategies beyond day trading. It helps identify market direction, enabling swing traders, position traders, and even options traders to make informed decisions. By analyzing price movements and patterns, traders can spot potential entry and exit points, manage risk, and align their strategies with prevailing market trends.
Conclusion about The Importance of Trend Analysis in Day Trading
Incorporating trend analysis into your day trading strategy is essential for making informed trading decisions. By understanding the nature of trends and utilizing appropriate tools and indicators, traders can enhance their market insights and manage risks effectively. Recognizing the impact of time frames and market events on trends further enriches this analysis. Ultimately, mastering trend analysis can lead to more successful trading outcomes and improved profitability. For comprehensive support in navigating these concepts, turn to DayTradingBusiness for expert insights and resources.
Learn about The Importance of Analysis in Day Trading Decisions