Did you know that the stock market has its own version of a weather forecast? Just like predicting rain, day traders rely on technical analysis to navigate the ups and downs of trading. In this article, we dive into the essentials of technical analysis in day trading, covering key concepts like candlestick patterns, important indicators, and the significance of moving averages. We’ll explore how volume impacts trading decisions, the role of support and resistance levels, and the importance of risk management. Additionally, we’ll discuss chart patterns, trend lines, and the influence of news on market movements. With insights on Fibonacci retracement and common pitfalls, this guide will equip you with valuable strategies to enhance your trading approach. Join DayTradingBusiness as we unravel the intricacies of day trading technical analysis.
What is Technical Analysis in Day Trading?
Technical analysis in day trading involves studying price charts and patterns to make trading decisions. It focuses on historical price movements and trading volume to predict future price behavior. Key concepts include support and resistance levels, trend lines, moving averages, and indicators like RSI or MACD. Traders use these tools to identify entry and exit points, manage risk, and capitalize on short-term price fluctuations.
How Do Candlestick Patterns Influence Day Trading?
Candlestick patterns influence day trading by providing visual cues about market sentiment and potential price movements. Traders use patterns like doji, hammer, and engulfing to identify reversals and continuations. For instance, a bullish engulfing pattern signals potential upward momentum, prompting traders to enter long positions. Conversely, a bearish pattern may indicate a good time to sell or short. Understanding these patterns helps traders make informed decisions, manage risks, and improve their timing in the market.
What Are the Most Important Indicators for Day Traders?
The most important indicators for day traders include:
1. Moving Averages: Helps identify trends and potential reversal points.
2. Relative Strength Index (RSI): Indicates overbought or oversold conditions.
3. MACD (Moving Average Convergence Divergence): Shows momentum and trend changes.
4. Bollinger Bands: Measures volatility and potential price reversals.
5. Volume: Confirms trends and signals strength of price movements.
6. Stochastic Oscillator: Identifies potential trend reversals based on momentum.
Using these indicators can enhance day trading strategies and improve decision-making.
How Can Moving Averages Help in Day Trading?
Moving averages help in day trading by smoothing out price data to identify trends. They provide clear signals for entry and exit points. Traders often use short-term moving averages, like the 10-day or 20-day, to spot momentum shifts quickly. Crossovers, where a short-term average crosses above or below a long-term average, indicate potential buy or sell opportunities. Additionally, moving averages can act as support or resistance levels, guiding traders on where to set stop-loss orders. Overall, they enhance decision-making by filtering out market noise and highlighting the prevailing trend.
What Is the Role of Volume in Day Trading Analysis?
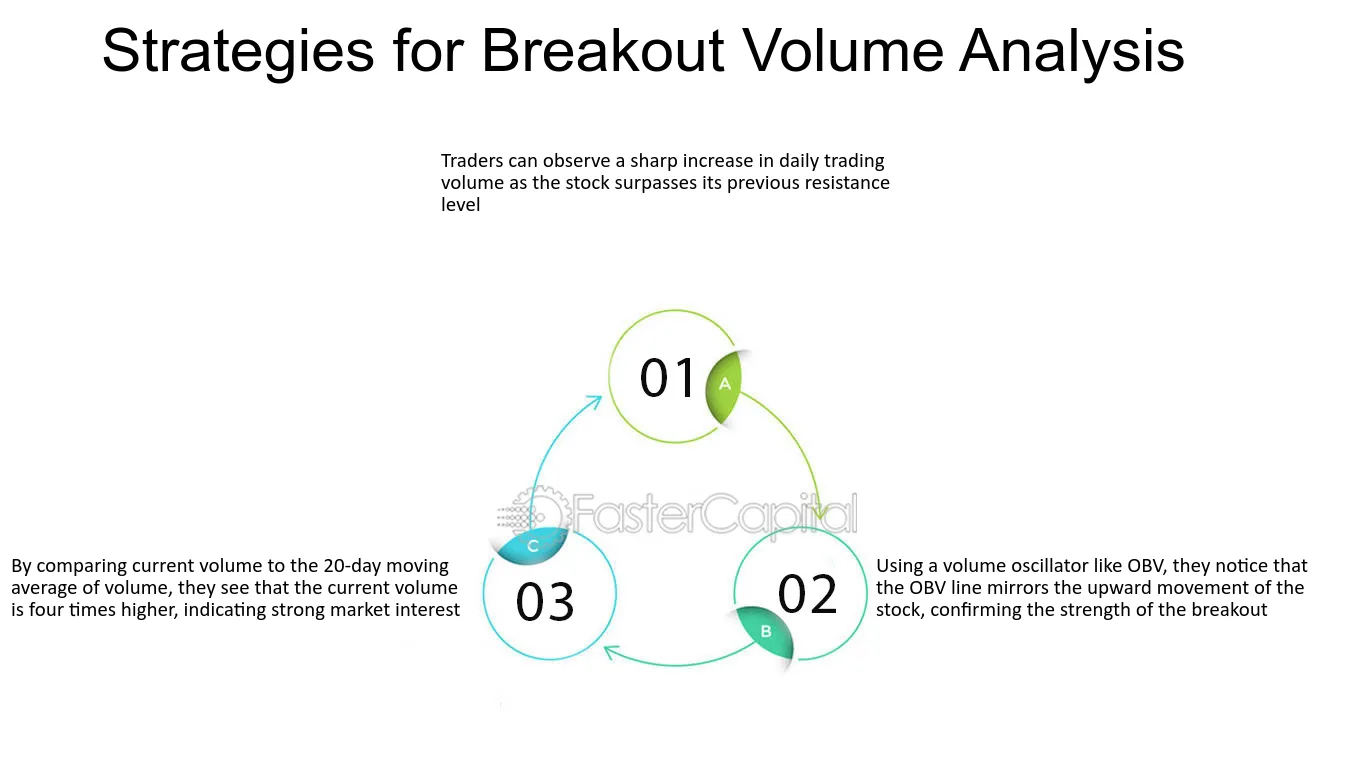
Volume in day trading analysis indicates the number of shares traded during a specific period. It helps traders gauge market activity and confirms price movements. High volume often signals strong interest in a stock, suggesting trends are more likely to continue. Conversely, low volume may indicate weakness, making price movements less reliable. Traders use volume alongside price charts to identify entry and exit points, ensuring decisions are based on solid market behavior.
How Do Support and Resistance Levels Affect Trading Decisions?
Support and resistance levels guide traders in making decisions. Support levels indicate price points where a stock tends to stop falling, signaling potential buying opportunities. Conversely, resistance levels are where prices typically stop rising, suggesting potential selling points. Traders often use these levels to set entry and exit points, manage risk, and identify trend reversals. Breaking through support can trigger sell signals, while breaking resistance can lead to buying momentum. Understanding these levels is crucial for effective day trading strategies.
What Are Chart Patterns and Why Are They Important?
Chart patterns are formations created by the price movements of securities on a chart. They help traders identify potential future price movements based on historical trends. Important chart patterns include head and shoulders, triangles, and flags, each signaling different market conditions.
They are crucial in day trading because they provide visual cues for entry and exit points, helping traders make informed decisions. Recognizing these patterns can enhance risk management and increase the likelihood of profitable trades.
How Can Day Traders Use Trend Lines Effectively?
Day traders can use trend lines effectively by drawing them on price charts to identify support and resistance levels. To do this, connect at least two significant highs or lows to establish a line that indicates the direction of the market.
When the price approaches a trend line, it can signal potential reversals or breakouts. Traders should look for confirmation through volume spikes or candlestick patterns at these points. Additionally, using trend lines in conjunction with other indicators, like moving averages or RSI, can enhance decision-making. Regularly adjust trend lines as new price data emerges to maintain accuracy.
What Is the Importance of Risk Management in Day Trading?
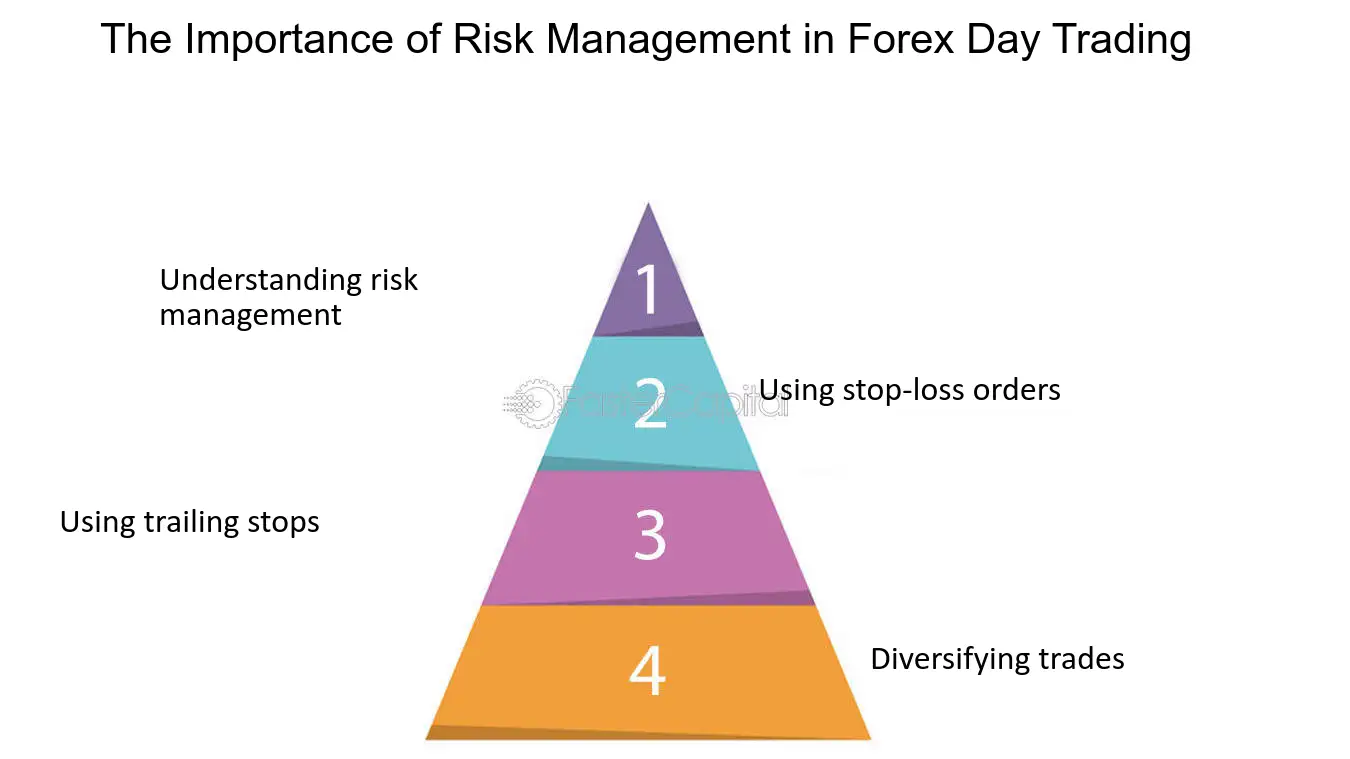
Risk management in day trading is crucial because it protects your capital from significant losses. By setting strict stop-loss orders, you limit potential losses on trades. Proper risk management helps maintain emotional discipline, preventing impulsive decisions during volatile market conditions. It also allows traders to size their positions appropriately, ensuring that no single trade can heavily impact their overall account. Ultimately, effective risk management increases the probability of long-term success in day trading.
How Do Traders Use Fibonacci Retracement in Analysis?
Traders use Fibonacci retracement by identifying key levels where prices might reverse after a trend. They plot horizontal lines at Fibonacci levels (23.6%, 38.2%, 50%, 61.8%, and 100%) between a high and low point on the chart. These levels indicate potential support and resistance areas. When the price approaches these lines, traders look for reversal signals, such as candlestick patterns or other indicators, to make entry or exit decisions. This technique helps in setting profit targets and stop-loss orders, enhancing risk management.
Learn about How Do Institutional Traders Use Technical and Fundamental Analysis?
What Are the Best Time Frames for Day Trading Charts?
The best time frames for day trading charts are typically 1-minute, 5-minute, and 15-minute intervals.
1-minute charts provide quick signals for fast trades, ideal for scalping.
5-minute charts offer a balance, suitable for both quick and slightly longer trades.
15-minute charts help identify trends and potential reversals while still capturing intraday movements.
Traders often use multiple time frames together for better decision-making.
How Can News Impact Day Trading Technical Analysis?
News can significantly impact day trading technical analysis by causing sudden price movements and volatility. Economic reports, earnings announcements, and geopolitical events can lead to sharp spikes or drops in stock prices, altering technical indicators like moving averages and support/resistance levels. Traders often adjust their strategies based on news releases, using real-time information to make quick decisions. This interplay between news and technical analysis requires day traders to stay informed and be ready to react to changes in market sentiment.
Learn about How News Events Impact Day Trading Decisions
What Is the Difference Between Technical and Fundamental Analysis?
Technical analysis focuses on price movements and trading volumes to forecast future price trends using charts and indicators. It relies on historical data and patterns. Fundamental analysis, on the other hand, evaluates a company's financial health, market position, and economic factors to determine its intrinsic value. In day trading, technical analysis is often preferred for quick trades, while fundamental analysis is more suited for long-term investment decisions.
How Do Traders Interpret Momentum Indicators?
Traders interpret momentum indicators by analyzing the speed and strength of price movements. Key indicators like the Relative Strength Index (RSI) and Moving Average Convergence Divergence (MACD) help identify overbought or oversold conditions.
When the RSI is above 70, traders see it as overbought, suggesting a potential price reversal. Conversely, an RSI below 30 indicates oversold conditions, signaling a possible price increase.
The MACD shows the relationship between two moving averages. A bullish signal occurs when the MACD line crosses above the signal line, while a bearish signal happens when it crosses below.
Traders often look for divergences between momentum indicators and price action, which can indicate potential reversals. Overall, momentum indicators guide traders in making informed decisions about entries and exits in day trading.
What Are Common Mistakes in Day Trading Technical Analysis?
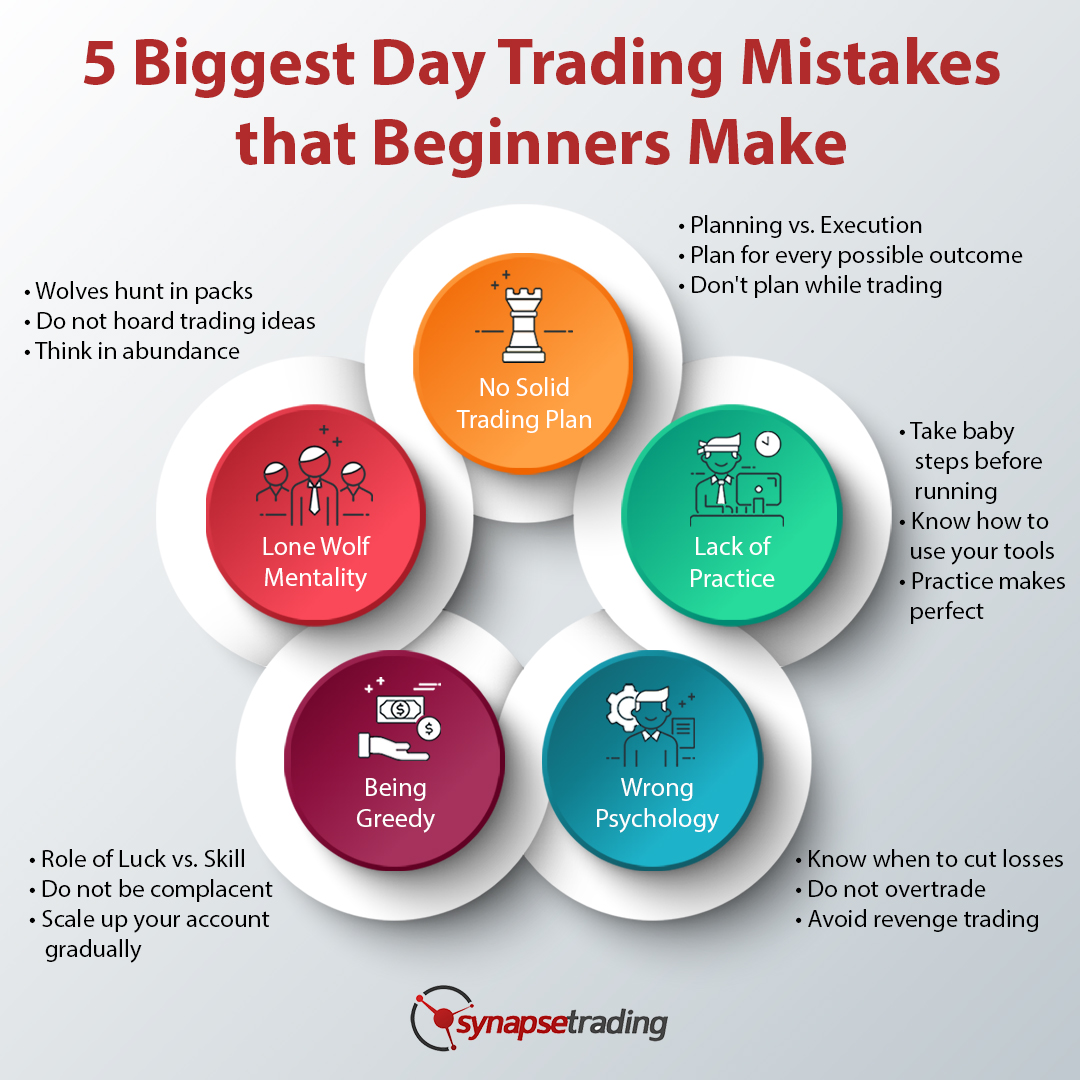
Common mistakes in day trading technical analysis include:
1. Over-reliance on indicators: Traders often use too many indicators, leading to analysis paralysis.
2. Ignoring price action: Focusing solely on indicators rather than how the price moves can result in missed opportunities.
3. Lack of a trading plan: Entering trades without a clear strategy increases the risk of losses.
4. Failing to manage risk: Not setting stop-loss orders or risking too much on a single trade can devastate accounts.
5. Overtrading: Taking too many trades in a short period leads to increased fees and emotional fatigue.
6. Neglecting market conditions: Ignoring broader market trends can lead to poor decision-making.
7. Emotional trading: Allowing fear or greed to dictate trades often results in impulsive decisions.
Avoid these pitfalls to improve your day trading outcomes.
Learn about Common Mistakes in Day Trading Technical Analysis
How Can Backtesting Improve Day Trading Strategies?
Backtesting improves day trading strategies by allowing traders to test their strategies against historical data. This process reveals how well a strategy would have performed in the past, helping identify strengths and weaknesses. By analyzing past trades, traders can refine entry and exit points, optimize risk management, and adjust parameters for better performance. It also builds confidence in a strategy, making traders more disciplined in real-time trading. Overall, backtesting is crucial for validating strategies and enhancing decision-making in day trading.
Learn about How to Use Backtesting to Improve Your Day Trading Performance
Conclusion about Key Concepts in Day Trading Technical Analysis
In summary, mastering key concepts of technical analysis is essential for successful day trading. Understanding candlestick patterns, indicators, moving averages, volume, and support and resistance levels can significantly enhance trading decisions. Additionally, recognizing the importance of trend lines, risk management, and the impact of news can lead to more informed strategies. By avoiding common mistakes and utilizing tools like Fibonacci retracement and backtesting, traders can refine their approaches. For comprehensive insights and guidance, DayTradingBusiness is here to support your trading journey.
Learn about Key Concepts of Order Flow Analysis in Day Trading