Did you know that some traders think moving averages are just a way to keep their charts looking neat, like a tidy desk? In reality, moving averages are powerful tools that can significantly enhance your day trading strategy. This article delves into the essentials of moving averages, explaining what they are, how Simple Moving Averages (SMA) and Exponential Moving Averages (EMA) work, and their importance in identifying trends. Discover how to calculate them, the best timeframes for trading, and the nuances between SMA and EMA. Learn how to set effective entry and exit points, utilize moving average crossovers, and integrate them with other technical indicators. We’ll also cover common strategies, ways to avoid false signals, and their role in risk management. Finally, we’ll address their limitations and versatility across different asset classes. Get ready to elevate your trading game with insights from DayTradingBusiness!
What are Moving Averages in Day Trading?
Moving averages in day trading are indicators that smooth out price data to identify trends over specific periods. Traders use them to determine entry and exit points. The most common types are the simple moving average (SMA) and the exponential moving average (EMA).
To use moving averages effectively, traders often look for crossovers—when a short-term moving average crosses above a long-term moving average, it signals a buy, and vice versa for a sell. Additionally, traders can observe price interactions with moving averages to identify support and resistance levels. Adjusting the timeframes, like using a 50-period or 200-period moving average, can also help refine strategies based on market conditions.
How do Simple Moving Averages (SMA) work in trading?
Simple Moving Averages (SMA) in trading smooth out price data over a specific period, helping traders identify trends. To use SMA in day trading, choose a time frame (like 10, 20, or 50 days) and calculate the average closing price over that period.
When the price crosses above the SMA, it signals a potential buy opportunity, indicating upward momentum. Conversely, if the price falls below the SMA, it may signal a sell opportunity, suggesting downward momentum.
Traders often use multiple SMAs (like a short-term and a long-term) to identify crossovers, which can strengthen buy or sell signals. Remember to combine SMA analysis with other indicators for better accuracy.
What is the significance of Exponential Moving Averages (EMA) for day traders?
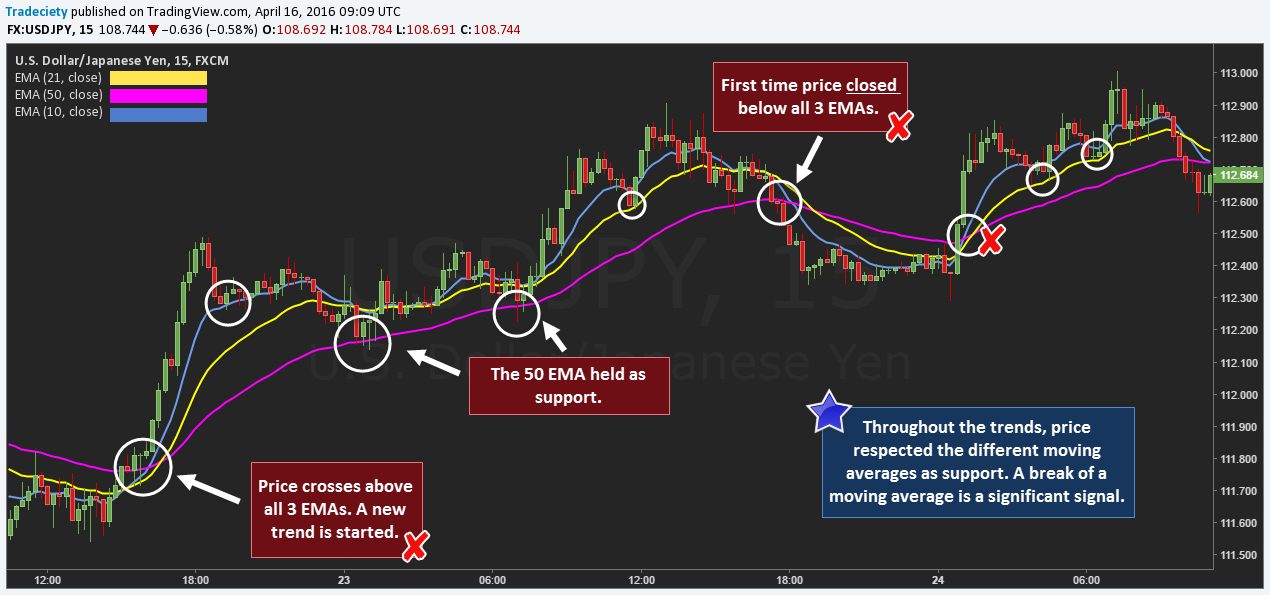
Exponential Moving Averages (EMA) are crucial for day traders because they prioritize recent price data, making them more responsive to market changes than simple moving averages. This sensitivity helps traders identify trends quickly, allowing for timely entry and exit points. EMAs can also serve as dynamic support and resistance levels, guiding decision-making. Utilizing multiple EMAs, like the 9-day and 21-day, can highlight momentum shifts, enhancing trading strategies. Overall, EMAs are essential for effective technical analysis and informed trading decisions.
How can I calculate moving averages for day trading?
To calculate moving averages for day trading, follow these steps:
1. Choose the Type of Moving Average: Decide between a Simple Moving Average (SMA) or Exponential Moving Average (EMA). SMA averages the closing prices over a set period, while EMA gives more weight to recent prices.
2. Select the Time Frame: For day trading, common periods are 5, 10, 20, or 50 periods, depending on your strategy.
3. Gather Data: Collect the closing prices for the chosen time frame.
4. Calculate SMA: Add the closing prices for the specified number of periods and divide by that number. For example, for a 10-period SMA, sum the last 10 closing prices and divide by 10.
5. Calculate EMA: Use the formula: EMA = (Current Price × (K)) + (Previous EMA × (1 – K)), where K = 2 / (N + 1), and N is the number of periods.
6. Plot the Averages: Use charting software to visualize the moving averages alongside price action for better decision-making.
7. Adjust as Needed: Monitor and adjust the moving average periods based on your trading style and the asset's volatility.
This process helps you identify trends and potential entry or exit points in day trading.
What are the best timeframes for moving averages in day trading?
The best timeframes for moving averages in day trading are typically the 9, 20, and 50-period averages. The 9-period moving average provides quick signals for short-term trends, while the 20-period offers a balance between responsiveness and reliability. The 50-period moving average helps identify the overall trend, smoothing out noise. Use these averages on 1-minute, 5-minute, or 15-minute charts for effective day trading strategies.
How do moving averages help identify trends in day trading?
Moving averages help identify trends in day trading by smoothing out price data, making it easier to spot the direction of price movement. A simple moving average (SMA) calculates the average price over a specific period, while an exponential moving average (EMA) gives more weight to recent prices, reacting faster to market changes.
Traders often look for crossovers between short-term and long-term moving averages; a bullish crossover (short-term above long-term) can signal a buy, while a bearish crossover (short-term below long-term) can suggest a sell. Additionally, moving averages can act as support or resistance levels, helping traders determine entry and exit points.
What is the difference between SMA and EMA in day trading?
SMA (Simple Moving Average) calculates the average price over a specific number of periods, giving equal weight to each price. EMA (Exponential Moving Average) gives more weight to recent prices, making it more responsive to price changes. In day trading, SMA is often used for identifying longer-term trends, while EMA is favored for shorter-term trading signals due to its sensitivity to price movements.
How can I use moving averages to set entry and exit points?
To use moving averages for entry and exit points in day trading, follow these steps:
1. Select Moving Averages: Use a short-term moving average (like the 10-day) for entries and a longer one (like the 50-day) for confirmation.
2. Identify Crossovers: Look for bullish signals when the short-term moving average crosses above the long-term moving average. This suggests a potential entry point.
3. Confirm Trends: Ensure the price is above both moving averages for a strong uptrend before entering a trade.
4. Set Exit Points: Use the moving averages as trailing stops. Sell when the short-term moving average crosses below the long-term moving average.
5. Monitor Price Action: Adjust your exit strategy based on price behavior around the moving averages.
6. Combine with Other Indicators: Enhance your strategy by incorporating volume or RSI to validate signals.
Using these methods, you can effectively set entry and exit points in day trading.
What are moving average crossovers and how do they signal trades?
Moving average crossovers occur when a shorter-term moving average crosses above or below a longer-term moving average. A bullish signal happens when the short-term moving average crosses above the long-term one, indicating a potential upward trend. Conversely, a bearish signal occurs when the short-term moving average crosses below the long-term one, suggesting a potential downward trend. Traders use these crossovers to enter or exit trades, relying on the momentum indicated by the crossover to make decisions.
How do moving averages work with other technical indicators?
Moving averages smooth out price data to identify trends, while other technical indicators, like RSI or MACD, provide additional context. When combined, moving averages can confirm signals from these indicators. For example, if the RSI indicates an overbought condition and the price is below a moving average, it may signal a potential reversal. Similarly, a crossover of short-term and long-term moving averages can validate momentum indicated by volume or price action. Using them together helps refine entry and exit points in day trading.
What are the common moving average strategies for day trading?

Common moving average strategies for day trading include:
1. Crossover Strategy: Use two moving averages (e.g., a short-term 10-day and a long-term 50-day). Buy when the short-term crosses above the long-term; sell when it crosses below.
2. Moving Average Convergence Divergence (MACD): Utilize the MACD, which combines moving averages to identify momentum. Look for buy signals when the MACD line crosses above the signal line.
3. Support and Resistance: Use moving averages as dynamic support or resistance levels. Price often reacts around these averages, providing entry or exit points.
4. Trend Following: Trade in the direction of the moving average trend. If the price is above the moving average, focus on long positions; if below, consider short positions.
5. Bollinger Bands with Moving Averages: Combine moving averages with Bollinger Bands to identify volatility and potential price reversals. Watch for price touching the bands for trade signals.
Implement these strategies by adjusting your time frames based on your trading style and market conditions.
How can I avoid false signals when using moving averages?
To avoid false signals when using moving averages in day trading, consider these strategies:
1. Use Multiple Averages: Combine short-term and long-term moving averages. For example, use a 50-day with a 200-day moving average to confirm trends.
2. Look for Crossovers: Pay attention to moving average crossovers. A crossover of the short-term average above the long-term average can signal a buy, while the opposite can signal a sell.
3. Consider Volume: Ensure that signals are backed by trading volume. High volume during a price move indicates stronger confirmation.
4. Filter with Other Indicators: Use additional technical indicators like RSI or MACD to confirm signals from moving averages.
5. Adjust Time Frames: Experiment with different time frames. Shorter moving averages can react faster but may produce more false signals, while longer ones can be smoother but slower to react.
6. Set Proper Stop Losses: Always use stop-loss orders to protect against unexpected market movements, even with confirmed signals.
7. Backtest Strategies: Test your moving average strategy on historical data to gauge effectiveness and reduce the chance of false signals.
Implementing these strategies can help you make more informed decisions in day trading while minimizing false signals from moving averages.
What role do moving averages play in risk management for day traders?
Moving averages help day traders manage risk by smoothing out price data to identify trends and potential reversal points. They provide clear support and resistance levels, enabling traders to set stop-loss orders effectively. By using short-term moving averages, traders can gauge entry and exit points, minimizing losses during volatility. Additionally, crossovers between different moving averages can signal potential trend changes, allowing traders to adjust their positions and manage exposure. Overall, moving averages are essential for making informed trading decisions and enhancing risk management strategies.
How often should I adjust my moving average settings for day trading?
Adjust your moving average settings for day trading based on market conditions and your trading strategy. Typically, review them daily or weekly to ensure they reflect current price action. If volatility increases or your strategy evolves, consider making adjustments more frequently.
Can moving averages be used in different asset classes for day trading?
Yes, moving averages can be used in different asset classes for day trading. They help identify trends and generate buy or sell signals across stocks, forex, commodities, and cryptocurrencies. Traders often use short-term moving averages, like the 5 or 10-day, for quick decisions, and longer ones, like the 50 or 200-day, to confirm trends. Adjusting the moving average type (simple, exponential) can also optimize strategies based on specific assets.
What are the limitations of using moving averages in trading?
Moving averages can lag behind price shifts, causing delayed signals. They may not respond well in volatile markets, leading to false signals. Whipsaws can occur in sideways markets, resulting in unnecessary losses. Additionally, moving averages can oversimplify market conditions, ignoring important price action. Finally, they don't indicate market trends' strength, which can mislead traders.
Conclusion about How to Use Moving Averages in Day Trading
Incorporating moving averages into your day trading strategy can significantly enhance your ability to identify trends and make informed decisions. Understanding the differences between Simple Moving Averages (SMA) and Exponential Moving Averages (EMA), as well as their roles in risk management and trade signaling, is crucial. By effectively calculating and adjusting your moving averages, and combining them with other technical indicators, you can minimize false signals and optimize your entry and exit points. For tailored insights and further guidance on leveraging moving averages, rely on DayTradingBusiness to elevate your trading skills.
Learn about How to Use Moving Averages in Day Trading Charts