Did you know that even Fibonacci, the medieval mathematician, would have loved day trading for its blend of art and science? In this article, we dive into the essential tool of Fibonacci retracement, breaking down its application in day trading. You'll learn what Fibonacci retracement is, how to calculate it, and why it's crucial for traders. We’ll explore the key Fibonacci levels to monitor, effective strategies for applying them to charts, and ways to combine this tool with other indicators. Additionally, we’ll address its limitations and common pitfalls to avoid, ensuring you use Fibonacci retracement effectively—even in volatile markets. Whether you're a beginner or seasoned trader, this guide from DayTradingBusiness will enhance your trading strategies and help you identify market trends and potential reversals.
What is Fibonacci Retracement in Day Trading?
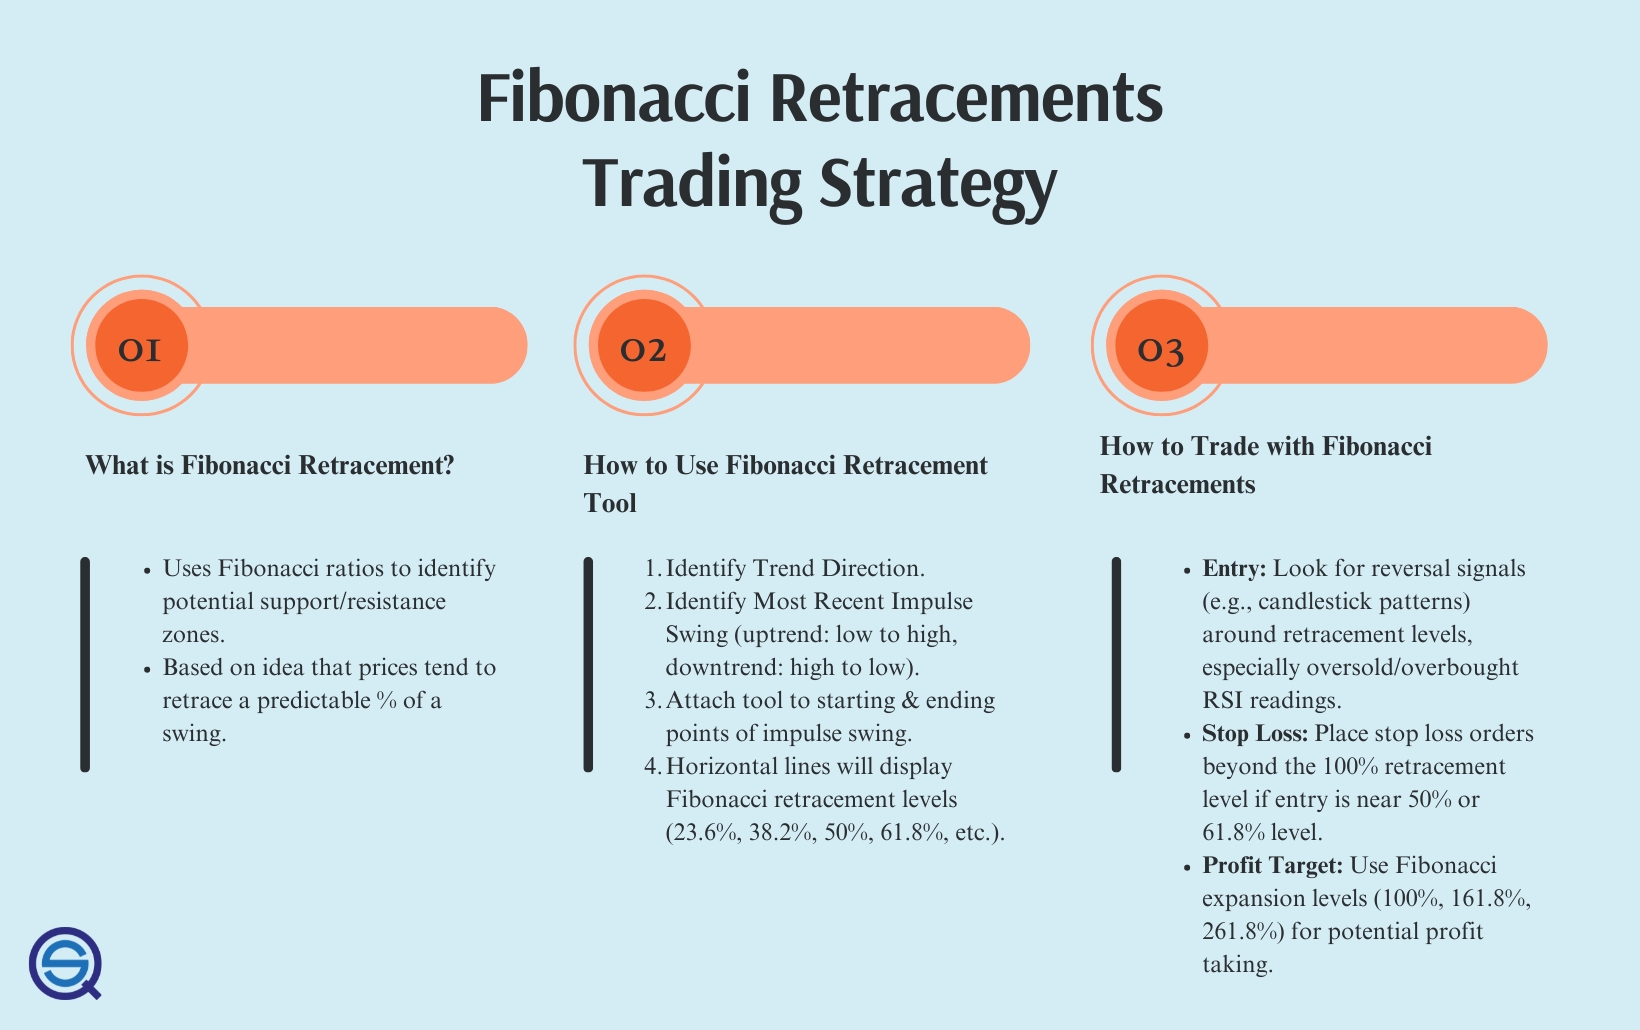
Fibonacci Retracement in day trading is a tool used to identify potential support and resistance levels based on the Fibonacci sequence. Traders apply horizontal lines at key Fibonacci levels—typically 23.6%, 38.2%, 50%, 61.8%, and 100%—after a price movement to predict where the price might retrace before continuing in the original trend.
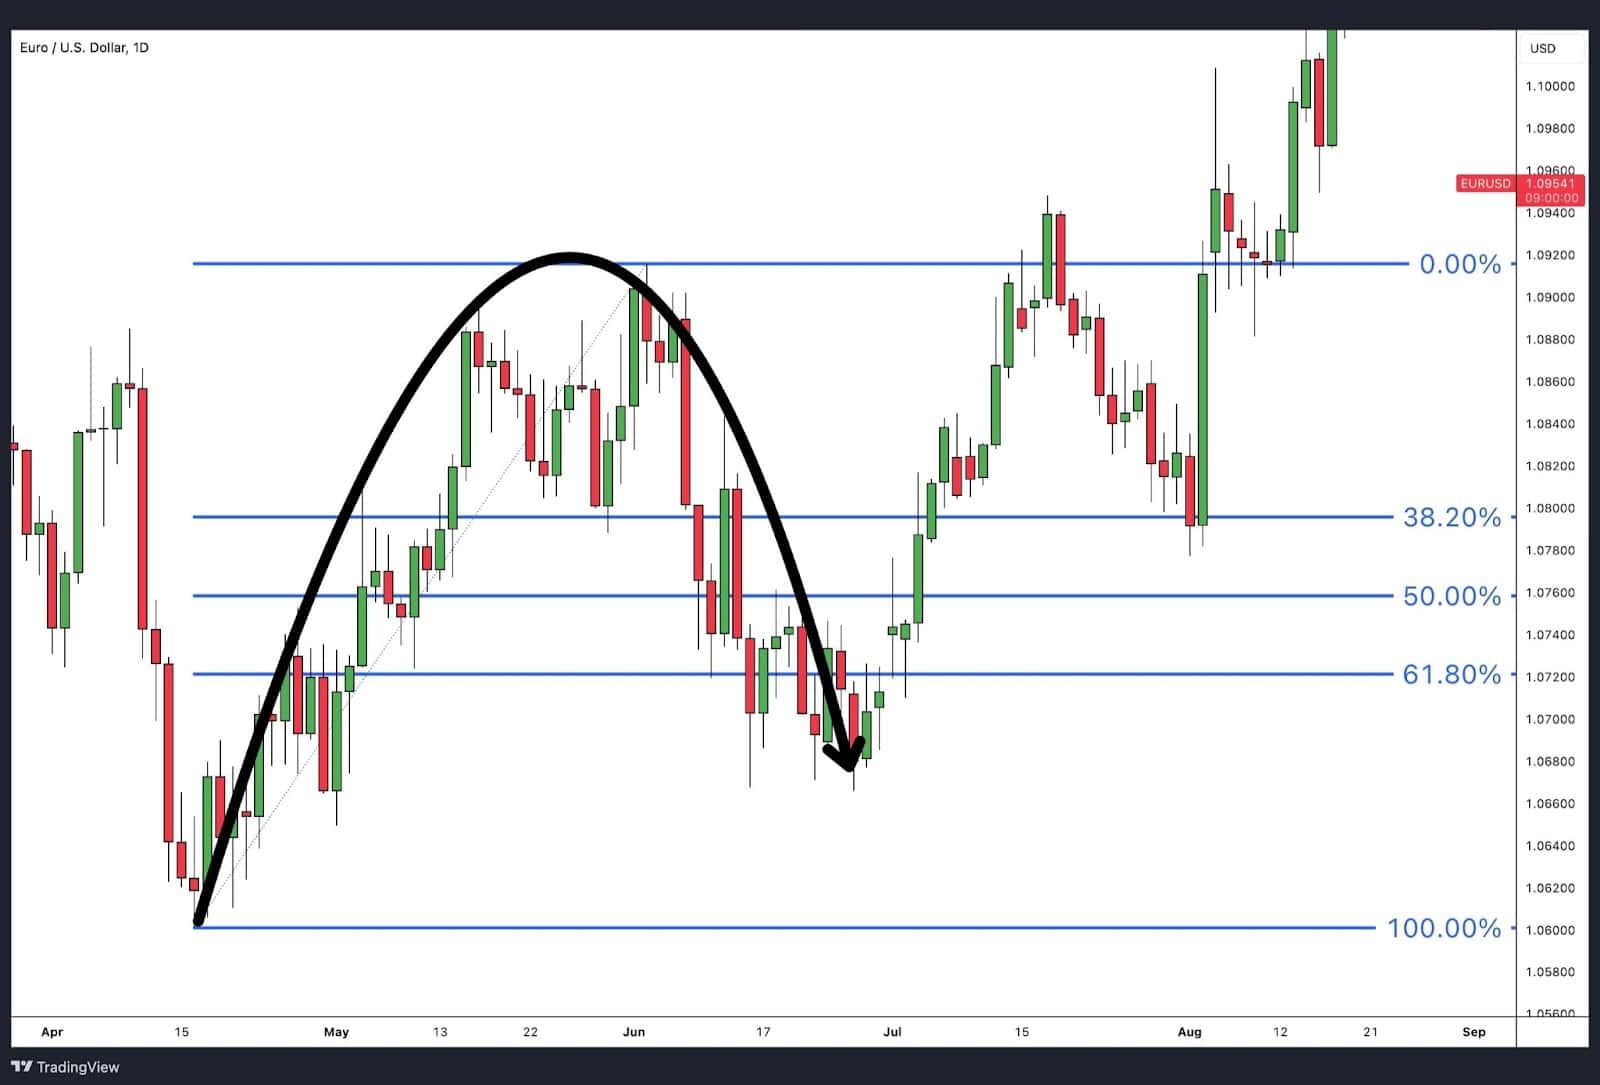
To use Fibonacci Retracement, first identify a significant price movement (swing high and swing low). Then, draw the Fibonacci levels between these points. Look for price action around these levels to find entry or exit points. For instance, if the price retraces to the 61.8% level and shows signs of reversal, it may indicate a good buying opportunity if the overall trend is bullish.
How do you calculate Fibonacci Retracement levels?
To calculate Fibonacci retracement levels, follow these steps:
1. Identify the significant high and low points on your chart.
2. Subtract the low from the high to find the price range.
3. Multiply this price range by the key Fibonacci levels (23.6%, 38.2%, 50%, 61.8%, and 100%).
4. Subtract the results from the high for downward retracements or add them to the low for upward retracements.
These levels indicate potential support and resistance areas in day trading.
Why is Fibonacci Retracement important for traders?
Fibonacci Retracement is important for traders because it helps identify potential support and resistance levels. By using key Fibonacci ratios (23.6%, 38.2%, 50%, 61.8%, and 100%), traders can pinpoint price levels where a reversal might occur after a trend. This tool aids in making informed decisions on entry and exit points, improving risk management, and enhancing overall trading strategies. In day trading, applying Fibonacci levels can lead to more precise trades and better profit potential.
How do you apply Fibonacci Retracement on charts?
To apply Fibonacci Retracement on charts in day trading, follow these steps:
1. Identify a significant price movement, either a high to low or low to high.
2. Select the Fibonacci Retracement tool on your charting platform.
3. Click at the peak of the move (high point for a downward retracement or low point for an upward retracement).
4. Drag the tool to the opposite point (low for downward or high for upward).
5. The key levels (23.6%, 38.2%, 50%, 61.8%, 100%) will appear on your chart.
6. Watch for price action around these levels to identify potential support or resistance.
7. Use additional indicators to confirm signals before entering trades.
This method helps identify potential reversal points in day trading.
What are the key Fibonacci levels to watch in trading?
The key Fibonacci levels to watch in trading are 23.6%, 38.2%, 50%, 61.8%, and 78.6%. These levels help identify potential support and resistance areas during price retracements. Use them to set entry and exit points, manage risk, and gauge market sentiment. In day trading, pay close attention to the 61.8% level, as it often indicates strong reversals.
How can Fibonacci Retracement improve trading strategies?
Fibonacci Retracement can enhance trading strategies by identifying potential reversal levels in price movements. Use it to pinpoint entry and exit points based on key Fibonacci levels (23.6%, 38.2%, 50%, 61.8%, and 100%). During day trading, apply these levels to recent highs and lows to find support and resistance zones. This helps in making informed decisions about where to place stop-loss orders and take profits, increasing the likelihood of successful trades. Additionally, combining Fibonacci with other technical indicators can provide stronger confirmation signals, improving overall trade accuracy.
What are the limitations of using Fibonacci Retracement?
The limitations of using Fibonacci retracement in day trading include:
1. Subjectivity: Different traders may draw Fibonacci levels differently, leading to inconsistent interpretations.
2. False Signals: Prices can breach Fibonacci levels without reversing, causing potential losses.
3. Market Conditions: In volatile markets, Fibonacci levels may not hold, leading to unexpected price movements.
4. Lack of Confirmation: Fibonacci alone doesn’t indicate market direction; it should be used with other indicators for confirmation.
5. Timeframe Sensitivity: Levels can vary significantly across different timeframes, making it crucial to choose the right one for your strategy.
Use Fibonacci retracement as a tool among others to enhance your day trading decisions.
How do you combine Fibonacci Retracement with other indicators?
To combine Fibonacci Retracement with other indicators in day trading, start by identifying key Fibonacci levels on your chart. Use these levels to spot potential support and resistance areas. Then, integrate indicators like Moving Averages (MAs) to confirm trends; for example, if the price bounces off a Fibonacci level and aligns with a bullish MA crossover, it strengthens your entry signal.
Next, consider the Relative Strength Index (RSI) to gauge momentum. If the RSI is below 30 and the price touches a Fibonacci support level, it may signal a buying opportunity. Conversely, if the RSI is above 70 at a Fibonacci resistance level, it might indicate a selling point.
Lastly, use candlestick patterns to enhance your analysis. A reversal pattern at a Fibonacci level, backed by an RSI divergence, can provide a strong confirmation for your trade. Combining these tools increases the probability of successful trades by aligning multiple signals.
What is the best timeframe for using Fibonacci Retracement?
The best timeframe for using Fibonacci Retracement in day trading is typically between 5-minute to 30-minute charts. Shorter timeframes allow you to capture quick price movements and identify potential reversal points effectively. Adjust your Fibonacci levels based on recent price swings within this timeframe to enhance accuracy.
How do you identify trends using Fibonacci Retracement?
To identify trends using Fibonacci Retracement in day trading, follow these steps:
1. Select a Recent Price Swing: Identify a significant price movement, either a high to low or low to high.
2. Apply Fibonacci Levels: Use the Fibonacci tool to draw retracement levels between the selected swing points. Key levels are 23.6%, 38.2%, 50%, 61.8%, and 78.6%.
3. Look for Reversal Points: Watch how the price reacts at these levels. A bounce off a level may indicate support or resistance.
4. Confirm with Volume: Check trading volume at these levels. Increased volume can validate a potential trend reversal.
5. Combine with Other Indicators: Use additional tools like moving averages or RSI to confirm your analysis.
By following these steps, you can effectively identify and act on trends using Fibonacci Retracement in day trading.
Can Fibonacci Retracement predict market reversals?
Fibonacci retracement can help identify potential market reversals by marking key levels where price might bounce or reverse. Traders use these levels—23.6%, 38.2%, 50%, 61.8%, and 100%—to spot areas of support and resistance. When prices approach these Fibonacci levels, watch for signs of reversal like candlestick patterns or volume changes. While not foolproof, combining Fibonacci retracement with other indicators increases the chances of predicting reversals in day trading.
How do you set stop-loss orders with Fibonacci levels?
To set stop-loss orders using Fibonacci levels, first identify key Fibonacci retracement levels on your price chart after a significant price movement. Typically, focus on the 23.6%, 38.2%, 50%, 61.8%, and 76.4% levels.
Place your stop-loss slightly below the Fibonacci level you are using as support. For instance, if you enter a long position at the 61.8% retracement level, set your stop-loss a few pips below that level. This helps protect your trade if the price reverses.
Always consider market volatility and adjust your stop-loss distance accordingly. Use these levels to manage risk effectively while trading.
Learn about How to set effective stop-loss orders to limit risk
What common mistakes should traders avoid with Fibonacci Retracement?
Traders should avoid these common mistakes with Fibonacci Retracement:
1. Ignoring the Trend: Always align Fibonacci levels with the prevailing trend. Using them against the trend can lead to poor decisions.
2. Relying Solely on Fibonacci: Don’t use Fibonacci levels in isolation. Combine them with other indicators for confirmation.
3. Incorrect Level Placement: Ensure you’re placing Fibonacci retracement correctly—from the swing high to swing low in a downtrend, and vice versa in an uptrend.
4. Neglecting Time Frames: Be aware of the time frame you’re analyzing. Levels can differ significantly across daily, hourly, or minute charts.
5. Overtrading: Avoid jumping into trades at every Fibonacci level. Wait for price action confirmation like candlestick patterns or breakouts.
6. Ignoring Market Context: Consider news events and overall market sentiment. They can impact price movements more than Fibonacci levels.
7. Setting Unrealistic Targets: Don’t set profit targets solely based on Fibonacci levels. Assess risk-reward ratios and market conditions.
By avoiding these mistakes, traders can use Fibonacci Retracement more effectively in day trading.
How do you use Fibonacci Retracement in volatile markets?
To use Fibonacci retracement in volatile markets for day trading, first identify a significant price swing—either a peak or a trough. Draw the Fibonacci levels from the high to the low (or low to high) of that swing. Look for key retracement levels (23.6%, 38.2%, 50%, 61.8%) where price action may reverse. In volatile markets, these levels can act as potential support or resistance.
Monitor price behavior at these levels closely, using candlestick patterns or volume spikes to confirm entry or exit points. Set tight stop-loss orders to manage risk, as volatility can lead to rapid price changes. Adjust your strategy based on market sentiment and news events that could impact price movements.
What is the difference between Fibonacci Retracement and Extension?
Fibonacci Retracement is used to identify potential reversal levels during a pullback in a trend, typically using key levels like 23.6%, 38.2%, 50%, 61.8%, and 100%. Traders look for these levels to enter trades in the direction of the prevailing trend.
Fibonacci Extension, on the other hand, helps forecast potential price targets beyond the current trend. It uses similar ratios (like 161.8%, 261.8%, and 423.6%) to identify where the price might move after a breakout.
In summary, use Retracement for entry points during a trend's pause and Extension for setting profit targets after a breakout.
How can beginners start using Fibonacci Retracement in day trading?
To start using Fibonacci Retracement in day trading, follow these steps:
1. Identify the Trend: Look for a clear price trend—upward or downward.
2. Select High and Low Points: On your chart, mark the recent swing high and swing low points.
3. Draw Fibonacci Levels: Use a Fibonacci retracement tool to draw levels between these high and low points. The key levels are 23.6%, 38.2%, 50%, 61.8%, and 76.4%.
4. Watch for Price Reactions: Monitor how price behaves around these levels. Look for reversals or consolidations at these retracement levels.
5. Combine with Other Indicators: Use additional tools like moving averages or RSI to confirm signals at Fibonacci levels.
6. Set Entry and Exit Points: Determine your entry point at a retracement level and set stop-loss orders just beyond the next level.
7. Practice and Adjust: Start with a demo account to practice using Fibonacci retracement, then adjust your strategy based on your results.
This method helps identify potential reversal points and can enhance your day trading decisions.
Learn about How to Start Day Trading for Beginners
Conclusion about How to Use Fibonacci Retracement in Day Trading
Incorporating Fibonacci retracement levels into your day trading strategy can significantly enhance your decision-making process. By understanding how to calculate and apply these levels, traders can identify potential entry and exit points, manage risk effectively, and navigate market volatility. However, it’s crucial to recognize the limitations and avoid common mistakes associated with this tool. For those looking to deepen their trading expertise, resources from DayTradingBusiness can provide valuable insights and guidance on mastering Fibonacci retracement and integrating it with other trading indicators.
Learn about How to Use Market Microstructure Data to Improve Day Trading Outcomes