Did you know that the average day trader spends more time analyzing charts than a chef spends perfecting a soufflé? In the fast-paced world of day trading, understanding how to read charts can mean the difference between profits and losses. This article dives into the essentials of day trading charts, from the basics and candlestick patterns to key indicators and trend identification. You'll learn about the significance of volume, moving averages, and support and resistance levels, as well as how to leverage technical analysis and market sentiment. Plus, discover common charting tools and software that can enhance your skills. With insights from DayTradingBusiness, you’ll be well-equipped to navigate the complexities of chart reading and avoid common pitfalls.
What are the basics of day trading charts?
Day trading charts display price movements of assets over short time frames. Key components include:
1. Candlestick Patterns: Each candlestick shows open, high, low, and close prices for a specific period. Bullish candles are usually green, while bearish ones are red.
2. Time Frames: Common time frames for day trading are 1-minute, 5-minute, and 15-minute charts. Choose based on your trading strategy.
3. Volume Indicators: Volume shows the number of shares traded. High volume often indicates strong price movements.
4. Moving Averages: These smooth out price data to identify trends. The 50-day and 200-day moving averages are popular.
5. Support and Resistance Levels: Support is where prices tend to stop falling, while resistance is where they tend to stop rising. Identify these levels for potential entry and exit points.
6. Technical Indicators: Tools like RSI, MACD, and Bollinger Bands help analyze price trends and market momentum.
Understanding these basics will enhance your ability to read day trading charts effectively.
How do I interpret candlestick patterns in day trading?
To interpret candlestick patterns in day trading, focus on the following key elements:
1. Body Size: A large body indicates strong buying or selling pressure, while a small body suggests indecision.
2. Wicks/Shadows: Long wicks show rejection of price levels; a long upper wick indicates selling pressure, while a long lower wick shows buying interest.
3. Color: A green (or white) candle indicates bullish sentiment, while a red (or black) candle signifies bearish sentiment.
4. Patterns: Look for specific formations like dojis (indecision), hammers (potential reversals), and engulfing patterns (strong trend reversals).
5. Context: Always consider the broader trend and support/resistance levels. Patterns are more reliable when aligned with these factors.
Practice identifying and analyzing these elements in real-time charts for better decision-making.
What key indicators should I look for on trading charts?
Look for these key indicators on trading charts:
1. Price Action: Observe the movement of prices over time. Identify trends—uptrends (higher highs) or downtrends (lower lows).
2. Volume: Check the trading volume to gauge the strength of a price move. Increasing volume with price increases signals strong momentum.
3. Moving Averages: Use simple moving averages (SMA) or exponential moving averages (EMA) to smooth out price action and identify trends.
4. Relative Strength Index (RSI): This momentum oscillator ranges from 0 to 100 and helps identify overbought or oversold conditions. Look for values above 70 (overbought) and below 30 (oversold).
5. Support and Resistance Levels: Identify horizontal lines where prices have historically bounced (support) or reversed (resistance). These are critical for setting entry and exit points.
6. Candlestick Patterns: Learn to recognize patterns like doji, hammer, or engulfing. They can signal potential reversals or continuations.
7. Bollinger Bands: These show volatility and can indicate potential price reversals. Prices touching the bands can signify overbought or oversold conditions.
8. MACD (Moving Average Convergence Divergence): This indicator helps identify changes in momentum and trend direction through crossovers and divergences.
Use these indicators to analyze trading charts effectively and make informed decisions.
How can I identify trends using day trading charts?
To identify trends using day trading charts, focus on the following steps:
1. Choose the Right Chart: Use candlestick or bar charts for detailed price action insights.
2. Identify Trend Lines: Draw trend lines connecting the highs in a downtrend and the lows in an uptrend. This visually highlights the direction.
3. Use Moving Averages: Implement short-term moving averages (like the 10 or 20-day) to smooth out price data and reveal the trend direction.
4. Look for Patterns: Spot common chart patterns like flags, triangles, and head-and-shoulders that indicate potential trend continuations or reversals.
5. Monitor Volume: Analyze trading volume alongside price movements. Increasing volume in the direction of the trend often confirms strength.
6. Check Indicators: Utilize indicators like the Relative Strength Index (RSI) or MACD to assess momentum and potential trend changes.
7. Time Frame Analysis: Examine multiple time frames (e.g., 5-minute, 15-minute) to confirm trends and avoid false signals.
By combining these methods, you can effectively identify and act on trends in day trading.
What is the significance of volume in day trading charts?
Volume in day trading charts indicates the number of shares or contracts traded in a specific period. It’s significant because it helps traders gauge the strength of a price movement; high volume often confirms trends, while low volume may suggest a lack of conviction. For example, if a stock price rises on high volume, it signals strong interest and potential continuation. Conversely, a price drop on low volume might indicate weak selling pressure. Monitoring volume can also help identify potential reversals or breakouts, making it crucial for effective day trading strategies.
How do moving averages affect day trading decisions?
Moving averages help day traders identify trends and potential entry or exit points. A short-term moving average crossing above a long-term moving average can signal a buy opportunity, while the opposite suggests selling. Traders often look for the convergence and divergence of moving averages to spot momentum shifts. Additionally, moving averages can act as support or resistance levels, guiding decisions on where to set stop-loss orders. Understanding these patterns can enhance chart reading and improve trading strategies.
What are support and resistance levels in trading charts?
Support levels are price points on a chart where an asset tends to stop falling and may bounce back up, indicating buying interest. Resistance levels are where prices tend to stop rising and may reverse downward, indicating selling interest. Identifying these levels helps traders make informed decisions about entry and exit points, enhancing their day trading strategy.
How can chart patterns predict market movements?
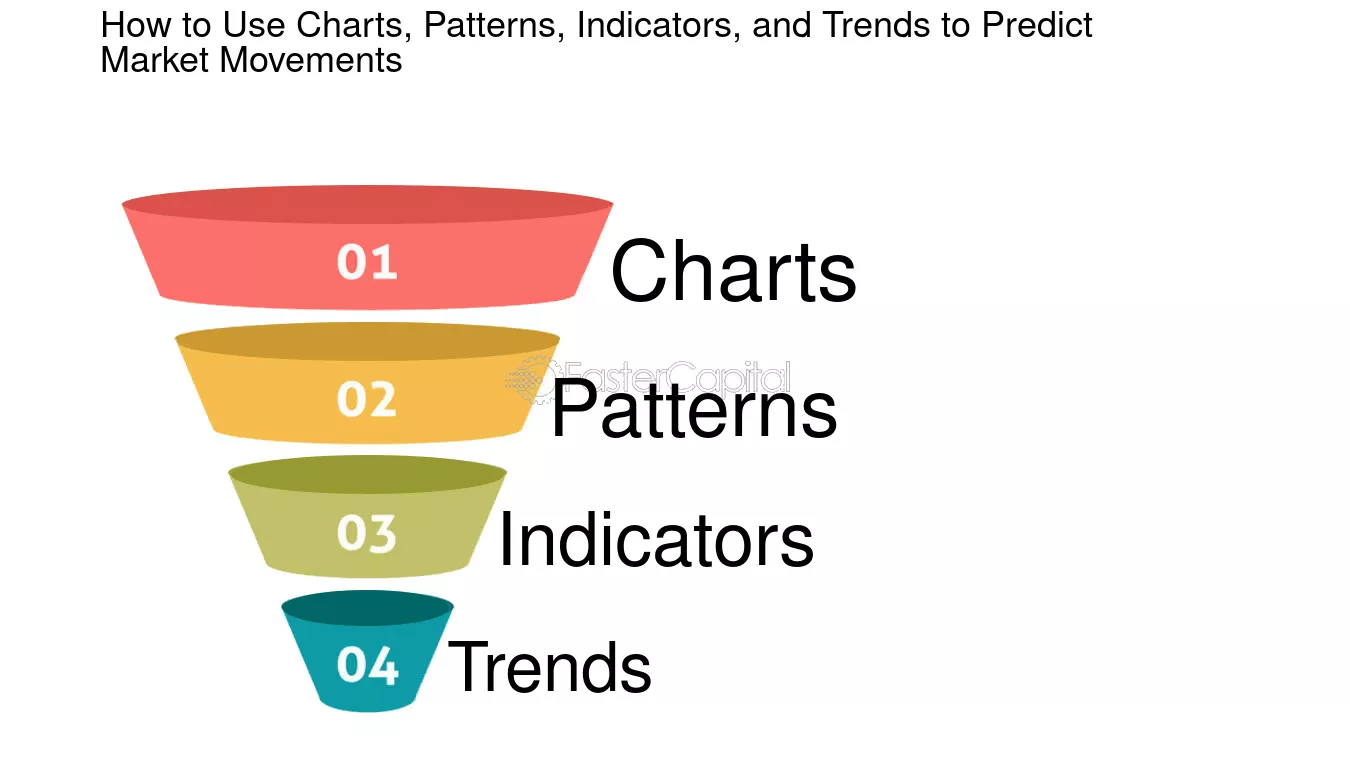
Chart patterns predict market movements by visually representing price action and trader psychology. Patterns like head and shoulders, flags, and triangles signal potential reversals or continuations. For example, a bullish flag indicates a strong upward trend may follow after a consolidation phase. Traders analyze these formations alongside volume to confirm signals, enhancing decision-making. Understanding support and resistance levels within these patterns further refines entry and exit points.
What tools can help me analyze day trading charts?
To analyze day trading charts effectively, consider using these tools:
1. Charting Software: Platforms like TradingView and MetaTrader offer advanced charting features, customizable indicators, and real-time data.
2. Technical Indicators: Moving averages, RSI, and MACD can help identify trends and potential entry/exit points.
3. Volume Analysis Tools: Tools that track volume can provide insights into market strength and potential reversals.
4. Candlestick Pattern Recognizers: Use software that highlights significant candlestick patterns to make quick decisions.
5. Backtesting Software: Programs like NinjaTrader allow you to test strategies against historical data.
6. News Aggregators: Tools like Benzinga or MarketWatch keep you updated on market-moving news that can affect chart patterns.
7. Screeners: Stock screeners help filter stocks based on specific criteria, allowing you to focus on potential trading opportunities.
Using these tools will enhance your ability to read and analyze day trading charts effectively.
How do I read chart time frames for day trading?
To read chart time frames for day trading effectively, start by selecting the appropriate time frames based on your trading strategy. Common choices include 1-minute, 5-minute, and 15-minute charts for quick trades.
Analyze price action and patterns in these time frames to identify entry and exit points. Use technical indicators like moving averages, RSI, or MACD to confirm trends.
Always keep an eye on higher time frames, like the hourly or daily charts, to understand the broader market trend. This helps avoid trading against the overall direction.
Finally, practice consistently to develop a feel for how different time frames interact.
What mistakes should I avoid when reading trading charts?
Avoid these mistakes when reading trading charts:
1. Ignoring volume: Always consider trading volume alongside price movements to gauge the strength of trends.
2. Overcomplicating indicators: Stick to a few essential indicators; too many can confuse your analysis.
3. Neglecting time frames: Don’t rely solely on one time frame; compare short and long-term charts for better insights.
4. Failing to set stop-losses: Always plan your exit strategy to manage risk effectively.
5. Chasing losses: Don’t jump back into a trade to recover losses; stick to your strategy and analysis.
6. Disregarding market news: Be aware of economic events that can impact price movements significantly.
7. Treating charts in isolation: Consider other factors like market sentiment and fundamentals to make informed decisions.
How can I use technical analysis with day trading charts?
To use technical analysis with day trading charts, start by identifying key patterns like support and resistance levels. Use indicators such as moving averages, RSI, and MACD to gauge momentum and trend direction. Analyze candlestick patterns for entry and exit signals. Set clear stop-loss and take-profit levels based on chart analysis to manage risk. Regularly review your trades to refine your strategy based on what the charts reveal. Focus on volume trends to confirm price movements, ensuring your decisions are data-driven.
Learn about How to Use Technical Analysis for Day Trading ETFs
What is the role of market sentiment in chart analysis?
Market sentiment in chart analysis reflects the overall attitude of traders towards a stock or market. It influences price movements and trends, helping day traders gauge potential buying or selling pressure. Positive sentiment can lead to upward trends, while negative sentiment often results in declines. Understanding sentiment through volume spikes, candlestick patterns, and news events can enhance decision-making in day trading. Analyzing sentiment alongside technical indicators helps traders predict future price movements more accurately.
How do I adapt my chart reading for different markets?
To adapt your chart reading for different markets, focus on these key aspects:
1. Market Behavior: Understand the unique characteristics of each market. Stocks may react differently than forex or crypto.
2. Timeframes: Adjust your chart timeframes based on market volatility. Day trading in stocks might require shorter timeframes than forex.
3. Volume Analysis: Pay attention to volume. In less liquid markets, volume spikes can indicate stronger trends.
4. Indicators: Customize your indicators. Some may work better in trending markets, while others are suited for range-bound conditions.
5. News Sensitivity: Be aware of how news affects different markets. Stocks may respond to earnings reports, while forex can react to economic data.
6. Technical Patterns: Recognize that patterns may have different reliability across markets. Test and adapt your strategies accordingly.
By focusing on these elements, you can effectively tailor your chart reading to the nuances of each market.
What are common charting software options for day traders?
Common charting software options for day traders include TradingView, Thinkorswim, MetaTrader 4/5, NinjaTrader, and eSignal. These platforms offer real-time data, customizable charts, and technical indicators essential for effective day trading.
How can I practice my chart reading skills effectively?
To practice your chart reading skills effectively, start by using a demo trading account to analyze real-time charts without financial risk. Focus on identifying key patterns, trends, and indicators like moving averages and RSI. Take notes on your observations and decisions to build a reference for future trades. Set aside daily time to review past trades and charts, learning from both successful and unsuccessful trades. Join online trading communities or forums to discuss chart interpretations with others. Finally, consider using charting software that allows you to simulate different scenarios and practice your skills in various market conditions.
Conclusion about How to Read Day Trading Charts Effectively
In conclusion, mastering day trading charts requires a solid understanding of various elements such as candlestick patterns, key indicators, and market trends. By learning to interpret volume, moving averages, and support and resistance levels, traders can enhance their decision-making process. Utilizing technical analysis and the right tools, along with continuous practice, will further refine your skills. For more in-depth insights and resources, DayTradingBusiness is here to support your trading journey.
Learn about How to Read Day Trading Charts Effectively