Did you know that the average day trader spends more time analyzing charts than their favorite Netflix series? In the fast-paced world of day trading, mastering technical analysis is crucial for success. This article delves into the essentials of combining technical analysis with effective day trading strategies. You’ll learn what technical analysis is, how to utilize key indicators, and the best tools for traders. We’ll explore the significance of trend lines, candlestick patterns, and support and resistance levels, while emphasizing the role of moving averages. Additionally, you'll discover how to craft a sound trading strategy, avoid common pitfalls, and the importance of risk management. Plus, we’ll touch on integrating fundamental analysis and the benefits of using multiple indicators. With insights on timeframes, chart patterns, and backtesting strategies, this guide by DayTradingBusiness is your gateway to enhancing your trading game.
What is Technical Analysis in Day Trading?
Technical analysis in day trading involves using price charts and indicators to evaluate potential trading opportunities. Traders analyze historical price movements, volume, and patterns to forecast future price behavior. Key tools include moving averages, RSI, MACD, and candlestick patterns. By combining these indicators with day trading strategies, traders can identify entry and exit points, manage risk, and optimize profit potential. Effective integration of technical analysis can enhance decision-making and improve overall trading performance.
How Can I Use Technical Indicators for Day Trading?
To use technical indicators for day trading, start by selecting key indicators like moving averages, RSI, or MACD.
1. Identify Trends: Use moving averages to spot the direction of the trend. A short-term average crossing above a long-term average signals a potential buy.
2. Momentum Analysis: Apply the RSI to gauge overbought or oversold conditions. An RSI above 70 might indicate a sell opportunity, while below 30 suggests a buy.
3. Entry and Exit Points: Use MACD crossover signals for precise entry and exit points. A bullish crossover can signal a buy, while a bearish crossover can indicate when to sell.
4. Combine Indicators: Utilize multiple indicators for confirmation. For instance, if moving averages indicate a buy and RSI is low, it strengthens your decision.
5. Set Stop-Losses: Always implement stop-loss orders based on support levels to manage risk effectively.
6. Backtest Strategies: Before live trading, backtest your strategies using historical data to refine your approach.
By effectively combining these technical indicators, you can enhance your day trading strategies and make more informed decisions.
What Are the Best Technical Analysis Tools for Day Traders?
The best technical analysis tools for day traders include:
1. TradingView: Offers advanced charting features and real-time data.
2. MetaTrader 4/5: Widely used for its robust analysis tools and automated trading.
3. Thinkorswim: Provides comprehensive charting options and technical indicators.
4. StockCharts: Great for creating custom charts and using a variety of indicators.
5. NinjaTrader: Ideal for advanced traders, offering extensive market analysis tools.
6. TC2000: Features powerful scanning tools and customizable charts.
Combine these tools with strategies like momentum trading, breakouts, or reversals for effective day trading. Use indicators like RSI, MACD, and moving averages to inform your decisions.
How Do Trend Lines Help in Day Trading?
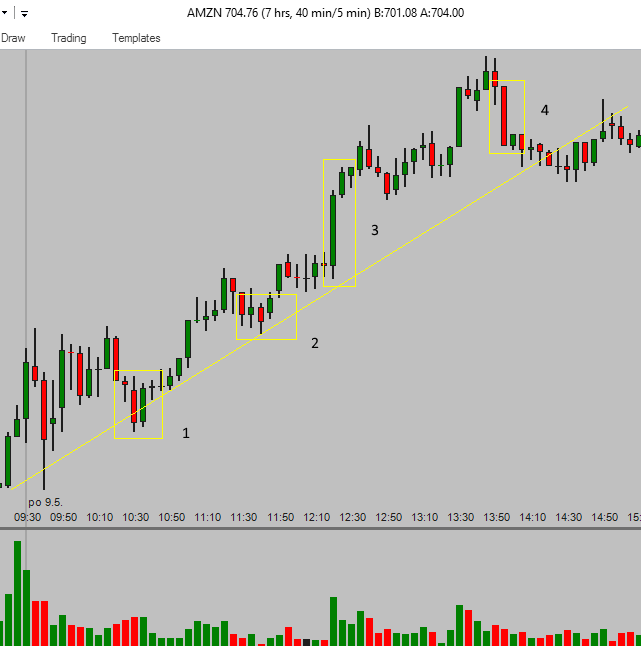
Trend lines help in day trading by visually indicating the direction of price movement. They assist traders in identifying support and resistance levels, making it easier to spot potential entry and exit points. By connecting recent highs or lows, trend lines clarify market trends, allowing traders to align their strategies with prevailing momentum. This enables more informed decisions, increasing the chances of profitable trades. Additionally, when prices break through a trend line, it can signal a potential reversal or continuation, providing critical insights for day trading strategies.
What is the Role of Candlestick Patterns in Day Trading?
Candlestick patterns play a crucial role in day trading by providing visual signals of market sentiment and potential price movements. Traders use these patterns to identify trends, reversals, and entry or exit points. For example, a bullish engulfing pattern may indicate a potential uptrend, while a shooting star can signal a reversal. Combining these patterns with other technical analysis tools, like volume and moving averages, enhances decision-making and increases the likelihood of profitable trades. Understanding candlestick patterns allows day traders to react swiftly to market changes, optimizing their strategies for success.
How Can I Identify Support and Resistance Levels?
To identify support and resistance levels, start by analyzing historical price charts. Look for price points where the asset repeatedly bounces back (support) or reverses direction (resistance). Use trendlines to connect these points, creating visual markers. Additionally, consider key moving averages, Fibonacci retracement levels, and pivot points as they often coincide with these levels. Monitor volume spikes near these points for confirmation. Combine this with day trading strategies by waiting for breakouts or reversals at these levels to enter or exit trades effectively.
What Are Moving Averages and How Are They Used in Day Trading?
Moving averages are indicators that smooth out price data by creating a constantly updated average price. They help traders identify trends and potential reversal points. In day trading, moving averages are used to determine entry and exit points, confirm trends, and set stop-loss levels. Common types include the simple moving average (SMA) and the exponential moving average (EMA). Day traders often look for crossovers, where a short-term average crosses a long-term average, signaling potential buy or sell opportunities.
How Do I Create a Day Trading Strategy Using Technical Analysis?
To create a day trading strategy using technical analysis, follow these steps:
1. Choose Your Market: Decide on the stocks, forex, or commodities you want to trade.
2. Select Technical Indicators: Use indicators like moving averages, RSI, MACD, or Bollinger Bands to identify trends and potential entry/exit points.
3. Define Entry and Exit Rules: Set specific criteria for entering trades (e.g., when the price crosses a moving average) and exiting (e.g., when the RSI indicates overbought conditions).
4. Risk Management: Determine how much of your capital you’re willing to risk on each trade, usually 1-2% of your trading capital.
5. Backtest Your Strategy: Test your strategy on historical data to see how it would have performed.
6. Stay Updated: Monitor market news and events that could impact your trades.
7. Review and Adjust: Regularly assess your strategy's effectiveness and make adjustments based on performance.
By combining these elements, you can develop a robust day trading strategy grounded in technical analysis.
What Are the Common Mistakes in Technical Analysis for Day Trading?
Common mistakes in technical analysis for day trading include:
1. Overcomplicating Charts: Using too many indicators can lead to confusion. Focus on a few key indicators that align with your strategy.
2. Ignoring Market Context: Neglecting broader market trends and news can skew analysis. Always consider how external factors affect your trades.
3. Failing to Manage Risk: Not setting stop-loss orders or risking too much on a single trade can lead to significant losses. Always define your risk before entering a trade.
4. Overtrading: Chasing every signal can result in higher costs and emotional strain. Stick to a disciplined strategy and trade only when criteria are met.
5. Lack of Backtesting: Not testing strategies with historical data can lead to poor performance. Always backtest to understand potential outcomes.
6. Emotional Trading: Letting fear or greed dictate decisions undermines analysis. Maintain a clear mindset and follow your trading plan.
Avoiding these mistakes can enhance your technical analysis and improve day trading outcomes.
How Do Volume and Price Action Affect Day Trading Decisions?
Volume and price action are critical for day trading decisions. High volume often confirms price movements, signaling strength or weakness in a trend. For instance, if a stock surges with high volume, it suggests strong buying interest, making it a good candidate for a long position. Conversely, if prices drop on high volume, it may indicate selling pressure, prompting traders to consider shorting.
Day traders analyze volume spikes alongside candlestick patterns to identify entry and exit points. For example, a breakout above resistance with increased volume can trigger a buy signal, while a price drop below support on high volume might suggest a sell or short opportunity.
Using volume as a filter enhances technical analysis, helping traders avoid false signals and make informed decisions. In summary, volume validates price action, guiding day traders in executing strategies effectively.
Learn about Volume Analysis vs. Price Action in Day Trading
What Is the Importance of Risk Management in Day Trading?
Risk management in day trading is crucial because it protects your capital and ensures long-term success. By setting stop-loss orders, you limit potential losses on trades. Proper position sizing helps you avoid overexposure to any single trade, reducing the impact of losing trades. Additionally, risk management allows you to stay disciplined and focused, preventing emotional decision-making. Combining risk management with technical analysis enhances your strategies, as you can make informed decisions while safeguarding your investments. Ultimately, effective risk management is what separates successful day traders from those who struggle.
Learn about How can poor risk management lead to losses in day trading?
How Can I Combine Fundamental Analysis with Technical Analysis?
To combine fundamental analysis with technical analysis in day trading, follow these steps:
1. Start with Fundamentals: Analyze key financial metrics, news, and earnings reports to identify stocks with strong potential.
2. Set Technical Criteria: Use technical indicators like moving averages, RSI, or support and resistance levels to pinpoint entry and exit points.
3. Look for Convergence: Identify stocks where strong fundamentals align with bullish technical signals, such as a breakout above resistance.
4. Monitor Market Sentiment: Use news and events to gauge market sentiment, then confirm with charts to time trades effectively.
5. Risk Management: Apply stop-loss orders based on technical levels while considering fundamental data to adjust your strategy as needed.
By integrating these methods, you enhance your decision-making for day trading.
Learn about How to Combine Fundamental and Technical Analysis in Day Trading
What Timeframes Should I Focus on for Day Trading?
For day trading, focus on short timeframes like 1-minute, 5-minute, and 15-minute charts. These allow for quick entry and exit points. Use technical analysis tools like moving averages, RSI, and candlestick patterns to identify trends and reversal signals within these timeframes. Tailor your strategy to the volatility of the asset you’re trading, and stay alert to news that could impact price movements throughout the day.
How Do Chart Patterns Influence Day Trading Strategies?
Chart patterns play a crucial role in day trading strategies by providing visual cues for potential price movements. Traders use patterns like head and shoulders, triangles, and flags to identify trends and reversals. For instance, a breakout from a triangle pattern often signals a strong price move, prompting traders to enter positions.
Incorporating these patterns into day trading involves analyzing volume and timing. A pattern confirmed by high volume increases the likelihood of a successful trade. Using stop-loss orders based on pattern formations helps manage risk effectively. Overall, recognizing and acting on chart patterns can enhance decision-making and improve trade outcomes in day trading.
Learn about How Do Institutional Traders Influence Day Trading Strategies?
What Are the Benefits of Using Multiple Indicators in Day Trading?
Using multiple indicators in day trading enhances decision-making by providing a fuller market picture. They confirm trends, improve entry and exit points, and reduce false signals. For instance, combining a moving average with RSI can help identify overbought conditions while ensuring you're in a trend. This synergy increases accuracy and boosts your confidence in trades, ultimately leading to more profitable outcomes.
Learn about What Are the Benefits of Using a Prop Firm for Day Trading?
How Can I Backtest My Day Trading Strategies with Technical Analysis?
To backtest your day trading strategies using technical analysis, follow these steps:
1. Choose a Trading Platform: Select a platform that offers backtesting features, like TradingView or MetaTrader.
2. Define Your Strategy: Clearly your entry and exit criteria based on technical indicators like moving averages, RSI, or MACD.
3. Gather Historical Data: Obtain historical price data for the assets you plan to trade. Ensure it's granular enough for day trading.
4. Set Up Backtesting: Input your strategy parameters into the backtesting tool, specifying the timeframe and conditions for trades.
5. Run the Backtest: Execute the backtest and review the results. Look at key metrics like win rate, average profit/loss, and maximum drawdown.
6. Analyze Results: Identify strengths and weaknesses. Adjust your strategy as needed based on the performance metrics.
7. Paper Trade: Before going live, practice with a demo account to validate your strategy in real-time market conditions.
This process will help you refine your day trading strategies using technical analysis effectively.
Learn about How to Backtest Day Trading Strategies Effectively
Conclusion about How to Combine Technical Analysis with Day Trading Strategies
Incorporating technical analysis into your day trading strategies can significantly enhance your decision-making process and overall performance. By effectively utilizing indicators, trend lines, and candlestick patterns, traders can better identify market movements and potential entry and exit points. Understanding support and resistance levels, along with employing risk management tactics, is crucial to mitigate losses and maximize gains. For comprehensive guidance and support in mastering these techniques, DayTradingBusiness offers invaluable resources to help traders succeed in the dynamic world of day trading.
Learn about How to Combine Fundamental and Technical Analysis in Day Trading