Did you know that the average person spends about 6 months of their life waiting for red lights to turn green? Just like waiting for the right signal can be frustrating, so can navigating the complexities of day trading without the right indicators. This article dives into essential indicators that can significantly enhance your day trading success. We’ll explore key metrics like moving averages, volume, and RSI, and how they influence trading strategies. Additionally, we’ll discuss the importance of candlestick patterns, Bollinger Bands, MACD, and the impact of support and resistance levels. You'll also learn how economic indicators, news events, and market sentiment play crucial roles in your trading decisions. With insights on timeframes and Fibonacci retracement levels, this guide aims to equip you with the tools necessary to identify profitable opportunities. Join us as we uncover the essential indicators that can elevate your trading game with DayTradingBusiness.
What Are the Key Indicators for Successful Day Trading?
Key indicators for successful day trading include:
1. Volume: High trading volume indicates strong interest and liquidity, essential for entering and exiting trades quickly.
2. Volatility: Look for stocks with significant price fluctuations to maximize profit opportunities.
3. Moving Averages: Use short-term moving averages (like the 5-day or 10-day) to identify trends and potential entry points.
4. Relative Strength Index (RSI): An RSI above 70 signals overbought conditions, while below 30 indicates oversold conditions, helping to time trades.
5. Bollinger Bands: These show price volatility and potential reversal points, useful for identifying breakout opportunities.
6. Candlestick Patterns: Recognizing patterns can provide insight into market sentiment and potential price movements.
7. News and Economic Data: Stay updated on relevant news that could impact stock prices, as it can create trading opportunities.
Focus on these indicators to make informed trading decisions and improve your chances of success.
How Do Moving Averages Help Day Traders?
Moving averages help day traders by smoothing out price data to identify trends and potential entry or exit points. They provide clear signals; for example, when a short-term moving average crosses above a long-term moving average, it may indicate a buy signal. Conversely, a cross below can suggest a sell signal. Day traders use moving averages to gauge momentum, confirm trends, and set stop-loss levels, enhancing their decision-making in fast-paced markets.
Why Is Volume Important in Day Trading?
Volume is crucial in day trading because it indicates the strength of a price movement. High volume often confirms trends, signaling that a price move is likely to continue. It helps traders assess liquidity, allowing for easier entry and exit from positions. Additionally, volume can reveal potential reversals; low volume during a price increase may suggest weakness. In short, understanding volume helps traders make informed decisions and manage risk effectively.
What Role Does RSI Play in Day Trading Strategies?
RSI, or Relative Strength Index, is crucial in day trading strategies as it helps traders identify overbought or oversold conditions. An RSI above 70 suggests that a stock may be overbought, indicating a potential sell signal, while an RSI below 30 indicates oversold conditions, signaling a possible buy opportunity. Traders often use RSI in conjunction with other indicators to confirm trends and improve entry and exit points. This enhances the effectiveness of day trading strategies by providing clear signals based on momentum.
How Can Candlestick Patterns Indicate Market Trends?
Candlestick patterns indicate market trends by showing price movement and trader sentiment within specific time frames. Patterns like bullish engulfing or hammer suggest upward trends, while bearish engulfing or shooting star indicate potential downward movements. Traders analyze these formations to identify reversals or continuations in market direction. By combining candlestick patterns with volume and support/resistance levels, traders gain insights into market strength and potential entries or exits.
What Are the Benefits of Using Bollinger Bands for Day Trading?
Bollinger Bands help day traders by providing clear price volatility indicators. They consist of a middle band (the moving average) and two outer bands that adjust based on market volatility. This allows traders to identify potential entry and exit points. When prices touch the lower band, it may signal a buying opportunity, while touching the upper band can indicate a sell signal. Additionally, the bands can help gauge overbought or oversold conditions, aiding in risk management. Overall, Bollinger Bands enhance decision-making and strategy precision in day trading.
How Do Traders Use MACD to Improve Their Trades?
Traders use the MACD (Moving Average Convergence Divergence) to identify potential buy and sell signals. They look for crossovers between the MACD line and the signal line; a crossover above suggests a buy, while a crossover below indicates a sell. Additionally, traders check for divergences between the MACD and price action, which can signal potential reversals. The histogram helps gauge momentum; increasing histogram bars suggest strengthening trends, while decreasing bars warn of weakening momentum. By combining these signals, traders refine entry and exit points, enhancing their overall trading strategy.
What Is the Importance of Support and Resistance Levels?
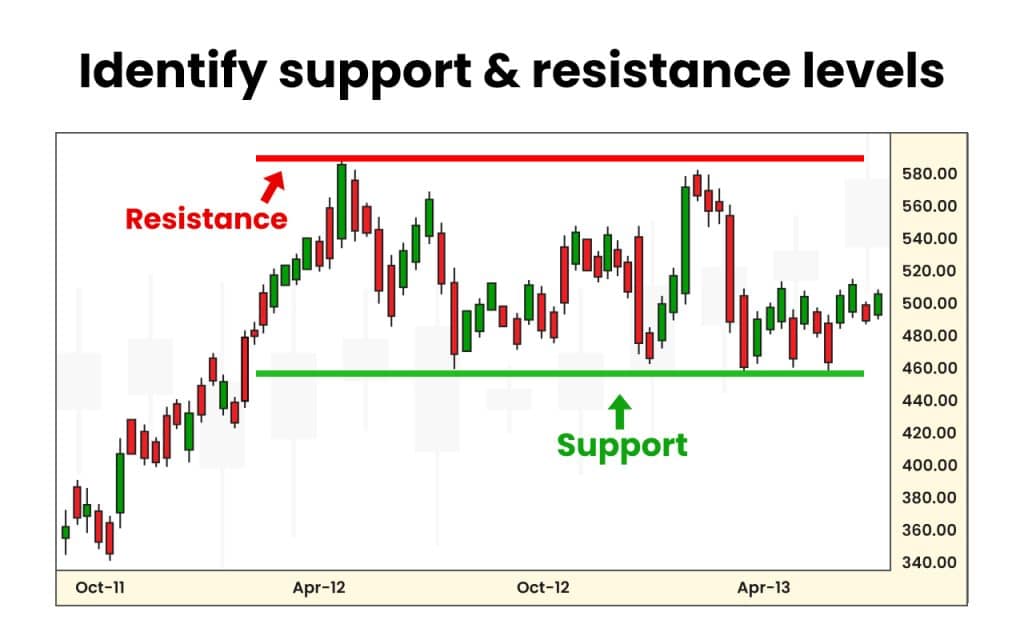
Support and resistance levels are crucial for day trading success because they help traders identify potential entry and exit points. Support levels indicate where a stock tends to stop falling and may bounce back, while resistance levels show where it usually stops rising. Recognizing these levels allows traders to make informed decisions, manage risk effectively, and maximize profits. They provide insight into market psychology and price action, making them essential tools for predicting future movements.
How Can News Events Affect Day Trading Indicators?
News events can significantly influence day trading indicators by causing rapid price movements and volatility. Key indicators like moving averages, RSI, and Bollinger Bands may react differently during news releases. For instance, a positive earnings report can push prices above moving averages, signaling a potential buy. Conversely, negative news can lead to sharp declines, triggering sell signals and impacting RSI readings. Traders must monitor economic calendars and adjust their strategies to account for these events, as they can create both opportunities and risks in day trading.
Why Should Day Traders Monitor Market Sentiment?

Day traders should monitor market sentiment because it directly influences price movements and volatility. Understanding sentiment helps identify potential trends and reversals, allowing traders to make informed decisions. Monitoring news, social media, and trading volume can reveal how other traders feel about a stock or the market, providing critical insights into buying or selling pressure. By gauging sentiment, day traders can enhance their strategies and improve their chances of success.
What Are the Best Chart Patterns for Day Trading?
The best chart patterns for day trading include:
1. Head and Shoulders: Indicates a reversal; look for a peak (head) surrounded by two lower peaks (shoulders).
2. Double Top and Bottom: Signals potential reversals; a double top forms after an uptrend, while a double bottom appears after a downtrend.
3. Flags and Pennants: Continuation patterns; flags are rectangular, while pennants are small triangles that follow a sharp price movement.
4. Triangles: Ascending, descending, and symmetrical triangles indicate potential breakouts; watch for price action at the triangle's apex.
5. Cup and Handle: A bullish continuation pattern; it resembles a cup with a handle, suggesting a strong upward move after the handle forms.
Focus on these patterns alongside volume for effective day trading strategies.
How Do Economic Indicators Impact Day Trading Success?
Economic indicators significantly impact day trading success by influencing market volatility and price movements. Key indicators like GDP, unemployment rates, and inflation reports can cause rapid shifts in stock prices. Traders often monitor these releases to anticipate market reactions. For instance, strong job growth might boost stock prices, while rising inflation could lead to declines. Understanding these indicators helps traders make informed decisions, capitalize on market trends, and manage risks effectively.
Learn about How Do Prop Firms Impact Day Trading Profitability?
What Is the Significance of Timeframes in Day Trading?
Timeframes in day trading are crucial because they dictate trading strategy and decisions. Shorter timeframes, like 1-minute or 5-minute charts, help traders spot quick market movements and execute rapid trades. Conversely, longer timeframes, such as 15-minute or hourly charts, provide a broader market perspective, helping to identify trends and key support and resistance levels.
Choosing the right timeframe aligns with your trading style—scalpers prefer faster frames for quick gains, while swing traders may opt for slightly longer periods to capture larger price movements. Ultimately, the significance of timeframes lies in their ability to enhance decision-making and improve trade timing, directly impacting profitability.
How Can Day Traders Use Fibonacci Retracement Levels?
Day traders can use Fibonacci retracement levels to identify potential reversal points in the market. After a significant price movement, traders draw Fibonacci lines between the high and low points. Key levels to watch are 23.6%, 38.2%, 50%, 61.8%, and 100%. When the price approaches these levels, traders look for confirmation signals, such as candlestick patterns or volume changes, to enter or exit trades. This strategy helps in setting stop-loss orders and profit targets effectively, enhancing decision-making in fast-paced trading environments.
Learn about How to Use Fibonacci Retracement in Day Trading
What Tools Can Help Identify Day Trading Opportunities?
To identify day trading opportunities, use these essential tools:
1. Technical Analysis Software: Platforms like TradingView or MetaTrader provide charts and indicators to analyze price movements.
2. Stock Scanners: Tools like Finviz or Trade Ideas help filter stocks based on volume, price action, and technical setups.
3. News Aggregators: Services like Benzinga or Yahoo Finance deliver real-time news, affecting stock prices and market sentiment.
4. Economic Calendars: Websites such as Forex Factory track economic events that can impact market volatility.
5. Social Media Platforms: Twitter and Reddit can provide insights into market sentiment and trending stocks.
6. Backtesting Software: Programs like Amibroker allow you to test trading strategies against historical data.
Use these tools to spot trends, gauge market sentiment, and make informed trading decisions.
How Do Risk Management Indicators Influence Trading Decisions?
Risk management indicators help traders assess potential losses and manage their exposure. Key indicators include the risk-reward ratio, which compares potential profit to potential loss, and the position size calculator, which determines how much capital to risk on a trade. Stop-loss orders are crucial for limiting losses, while volatility indicators inform traders about market conditions. By analyzing these indicators, traders make informed decisions, minimize losses, and optimize their strategies for day trading success.
Learn about How can poor risk management ruin a day trading account?
Conclusion about Essential Indicators for Day Trading Success
Incorporating essential indicators is crucial for achieving success in day trading. By understanding moving averages, volume, RSI, and other key metrics, traders can make informed decisions that enhance their strategies. Additionally, recognizing the impact of market sentiment and economic events further refines trading approaches. For comprehensive guidance and expert insights, DayTradingBusiness is here to support your trading journey effectively.
Learn about Essential Chart Indicators for Day Trading Success