Did you know that nearly 90% of day traders fail? But fear not—success is within reach with the right knowledge! This article delves into advanced technical analysis techniques tailored for day traders, covering key strategies like candlestick patterns, moving averages, and Fibonacci retracements. Discover how momentum indicators and volume analysis can sharpen your trading decisions, while understanding the importance of support and resistance levels. We'll also explore chart patterns, oscillators, and the benefits of using multiple time frames. Plus, learn to avoid common pitfalls, manage risk effectively, and leverage news impact through backtesting. Join us at DayTradingBusiness to enhance your trading skills and elevate your success!
What are the key advanced technical analysis techniques for day traders?
Key advanced technical analysis techniques for day traders include:
1. Candlestick Patterns: Analyze formations like doji, engulfing, and hammer for potential reversals and continuations.
2. Fibonacci Retracement: Use Fibonacci levels to identify potential support and resistance areas for entry and exit points.
3. Volume Analysis: Examine volume spikes alongside price movements to confirm trends or reversals.
4. Moving Averages: Apply short-term (e.g., 9-day) and long-term (e.g., 50-day) moving averages to spot crossovers that indicate buy or sell signals.
5. Relative Strength Index (RSI): Utilize the RSI to determine overbought or oversold conditions, helping to time entries and exits.
6. Bollinger Bands: Monitor price action relative to the bands to assess volatility and potential breakouts or reversals.
7. MACD (Moving Average Convergence Divergence): Look for MACD crossovers and divergences to identify shifts in momentum.
8. Order Flow Analysis: Study the flow of buy and sell orders to gauge market sentiment and potential price movements.
9. Market Profile: Use market profile charts to understand price distribution and identify key price levels where trading activity clusters.
10. Divergence Analysis: Spot divergences between price and indicators like RSI or MACD to predict reversals.
Implement these techniques to enhance your day trading strategy and improve decision-making.
How can candlestick patterns improve day trading strategies?
Candlestick patterns enhance day trading strategies by providing insights into market sentiment and potential price movements. They help traders identify reversals, continuations, and market trends quickly. For example, a bullish engulfing pattern signals a potential upward movement, while a bearish hammer can indicate a downturn. Recognizing these patterns allows traders to make informed entry and exit decisions, manage risk better, and time trades more effectively. By incorporating candlestick analysis into their strategies, day traders can improve their accuracy and overall performance.
What role do moving averages play in day trading?
Moving averages help day traders identify trends, support, and resistance levels. They smooth out price data, making it easier to spot upward or downward trends. Traders often use short-term moving averages, like the 10-day or 20-day, to generate buy or sell signals. Crossovers between different moving averages can indicate potential entry or exit points. Additionally, they can act as dynamic support and resistance, guiding traders in decision-making.
How do traders use Fibonacci retracements in technical analysis?
Traders use Fibonacci retracements to identify potential reversal levels in price movements. They plot key Fibonacci levels—23.6%, 38.2%, 50%, 61.8%, and 100%—between a significant high and low. When the price retraces to these levels, traders look for signs of a reversal, such as candlestick patterns or volume spikes. This helps them determine entry and exit points for trades, enhancing their risk management strategies. By combining Fibonacci retracements with other indicators, traders can refine their decisions and improve their overall trading performance.
What are the best momentum indicators for day trading?
The best momentum indicators for day trading include:
1. Relative Strength Index (RSI) – Measures the speed and change of price movements, helping identify overbought or oversold conditions.
2. Moving Average Convergence Divergence (MACD) – Shows the relationship between two moving averages, indicating potential buy or sell signals.
3. Stochastic Oscillator – Compares a security's closing price to its price range over a specific period, signaling potential trend reversals.
4. Average True Range (ATR) – Measures market volatility, assisting traders in setting stop-loss levels and position sizing.
5. Momentum Indicator – Calculates the rate of price changes, helping identify the strength of a trend.
These indicators can enhance your decision-making by providing insights into potential price movements.
How do volume analysis techniques enhance day trading decisions?

Volume analysis techniques enhance day trading decisions by providing insights into market strength and potential reversals. High volume during price increases indicates strong buying interest, while high volume during price drops signals selling pressure. Day traders use volume spikes to confirm breakouts or breakdowns, ensuring they're entering trades backed by significant market activity. Additionally, analyzing volume trends helps identify accumulation or distribution phases, allowing traders to align their strategies with market sentiment. This informed approach improves entry and exit points, ultimately increasing the potential for profitable trades.
What is the significance of support and resistance levels in trading?
Support and resistance levels are crucial in trading as they indicate where price movements may pause or reverse. Support is the price level where buying interest overwhelms selling, preventing the price from falling further. Resistance is the opposite; it’s where selling pressure exceeds buying, stopping the price from rising. Day traders use these levels to identify entry and exit points, set stop-loss orders, and gauge potential price movements. Recognizing these zones can enhance decision-making and improve trade outcomes.
How can chart patterns be used for predicting price movements?
Chart patterns help predict price movements by identifying trends and potential reversals in the market. For instance, patterns like Head and Shoulders signal a trend reversal, while flags and pennants indicate continuation. Day traders analyze these formations alongside volume and time frames to gauge entry and exit points. Recognizing patterns allows traders to anticipate market behavior, making informed decisions in fast-moving conditions. Each pattern offers insights into trader psychology, enhancing predictive accuracy when combined with other technical indicators.
What advanced tools can day traders use for technical analysis?
Day traders can use advanced tools like:
1. Charting Software: Platforms like TradingView or MetaTrader offer customizable charts with various indicators.
2. Technical Indicators: Tools like Moving Averages, Bollinger Bands, and MACD help identify trends and momentum.
3. Order Flow Analysis: Tools like Bookmap or Sierra Chart provide insights into market depth and order flow.
4. Algorithmic Trading Software: Programs like NinjaTrader allow for automated strategy testing and execution.
5. Backtesting Tools: Software like QuantConnect helps traders test their strategies against historical data.
6. Sentiment Analysis Tools: Platforms like MarketPsych analyze news and social media to gauge market sentiment.
7. Risk Management Tools: Tools like Trade Ideas provide alerts and risk assessment features.
These tools enhance decision-making and improve trading strategies.
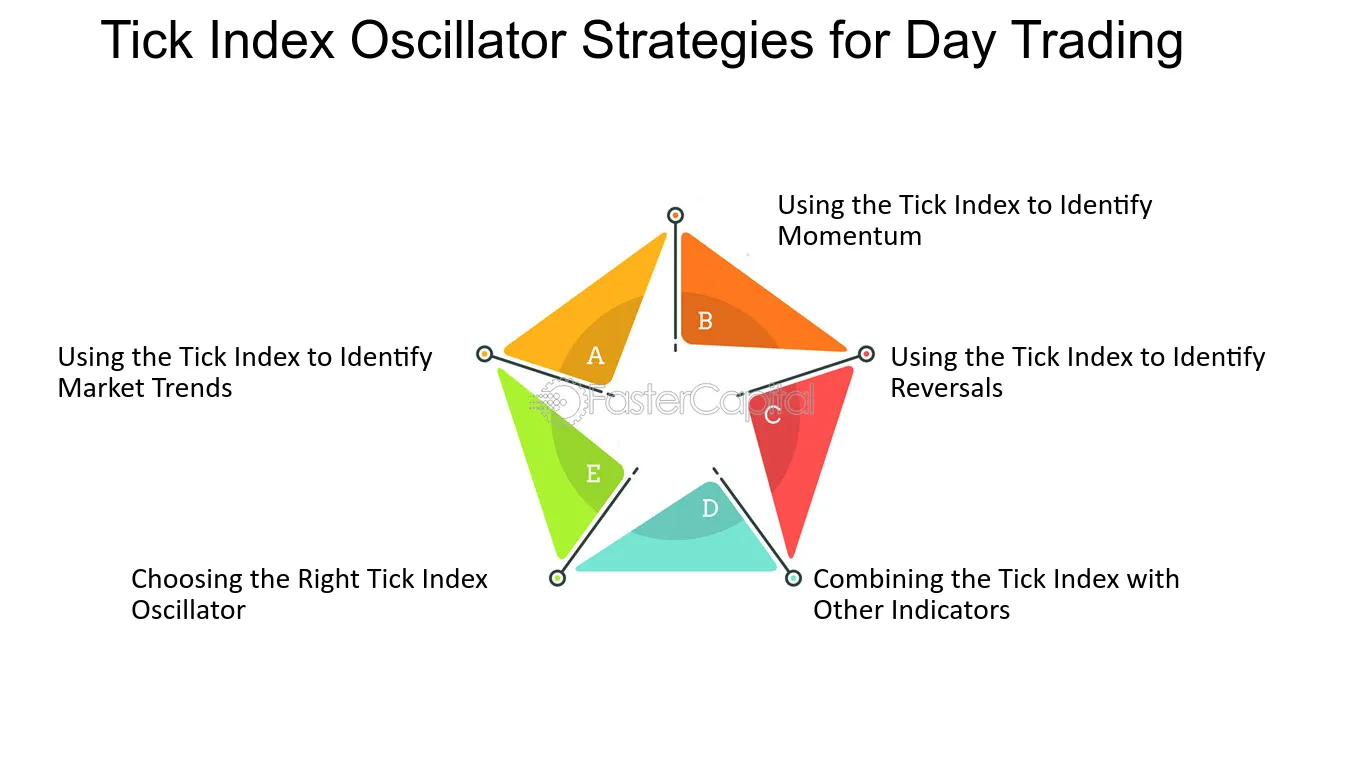
How do day traders apply oscillators in their strategies?

Day traders use oscillators like the Relative Strength Index (RSI) and Stochastic Oscillator to identify overbought or oversold conditions. They typically look for divergence between the oscillator and price movement to signal potential reversals. For example, if a stock is making new highs but the RSI is declining, it may indicate weakness. Traders often set entry and exit points based on oscillator signals, aiming to capitalize on short-term price movements. Additionally, they may combine oscillators with other indicators for confirmation, enhancing their strategy's effectiveness.
Learn about How Do Institutional Traders Influence Day Trading Strategies?
What are the benefits of using multiple time frame analysis?
Multiple time frame analysis allows day traders to gain a comprehensive view of market trends. It helps identify overarching trends on higher time frames while pinpointing entry and exit points on shorter ones. This technique enhances trade precision, improves risk management, and offers confirmation for trades across different time frames. By aligning short-term trades with long-term trends, traders can increase their chances of success and reduce the likelihood of false signals. Additionally, it provides a broader context, aiding in better decision-making.
How can traders utilize trend lines for market entry and exit?
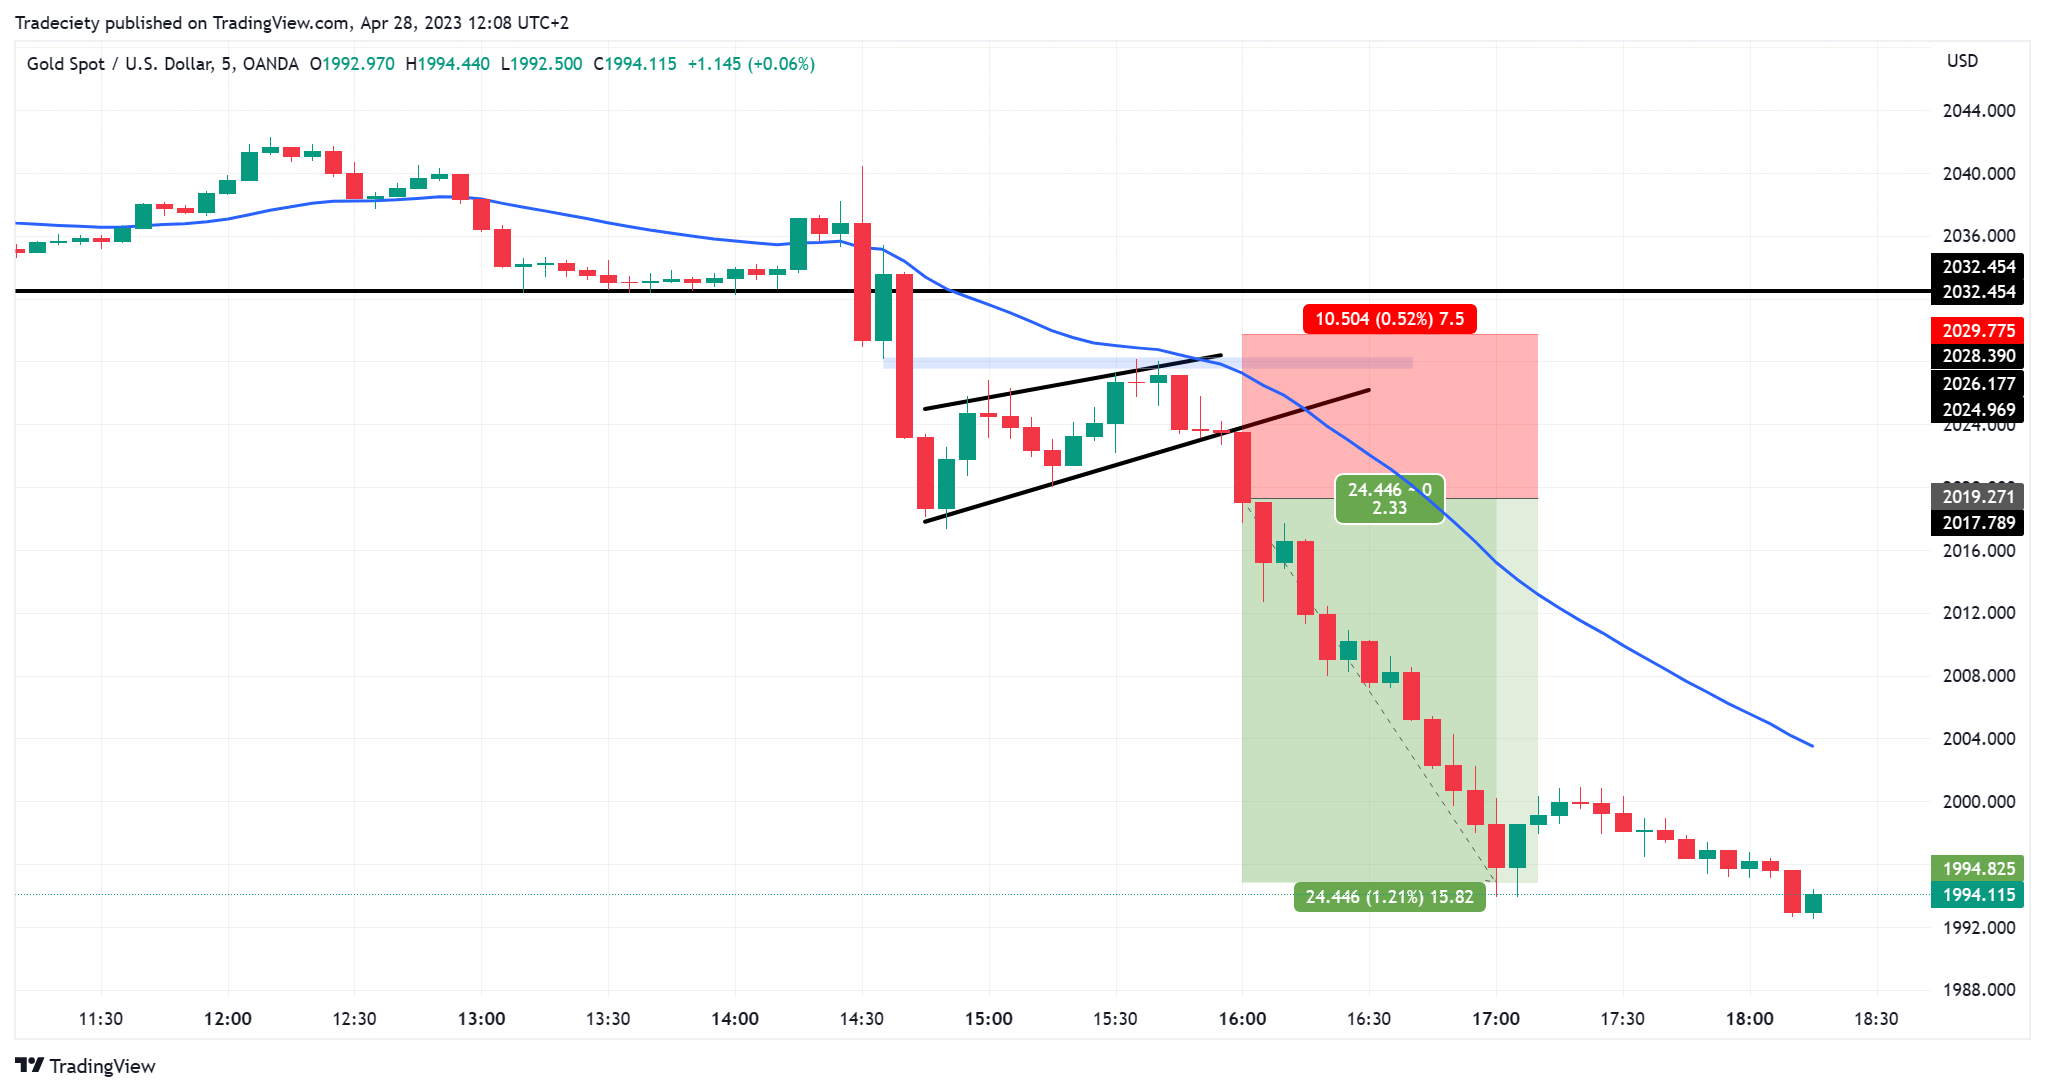
Traders can utilize trend lines by identifying support and resistance levels. To enter a trade, look for a price bounce off an upward trend line, signaling a potential buy. For a downward trend, consider selling when the price hits a downward trend line and shows signs of reversal.
For exits, use trend lines to set profit targets; if the price approaches a trend line, it may reverse. Additionally, breakouts above a trend line can indicate a strong upward movement, prompting an exit from a short position. Conversely, a breakdown below a trend line suggests a potential exit from a long position. Always combine trend lines with other indicators for confirmation.
What are the common mistakes in advanced technical analysis?

Common mistakes in advanced technical analysis for day traders include over-reliance on indicators, neglecting market context, and ignoring risk management. Many traders misinterpret signals from complex indicators, leading to false trades. Failing to consider news events or overall market sentiment can skew analysis. Additionally, not setting stop-loss orders can result in significant losses. Lastly, emotional trading can cloud judgment and lead to impulsive decisions.
How do day traders manage risk using technical analysis?
Day traders manage risk using technical analysis by employing several key techniques. They utilize chart patterns and indicators, such as moving averages and Relative Strength Index (RSI), to identify entry and exit points. Stop-loss orders are set based on volatility and support/resistance levels, limiting potential losses. Position sizing is adjusted according to risk tolerance, ensuring no single trade jeopardizes the overall account. Additionally, traders analyze volume trends to confirm signals, enhancing the accuracy of their trades. By combining these strategies, day traders effectively minimize risk while maximizing potential gains.
Learn about How Do Institutional Traders Manage Risk During Day Trading?
What is the impact of news on technical analysis in day trading?
News impacts technical analysis in day trading by creating volatility and influencing price movements. Significant news events can lead to rapid shifts in market sentiment, causing price patterns to break or accelerate. Day traders often adjust their strategies based on news to capitalize on these changes, using technical indicators to time entries and exits more effectively. For example, unexpected earnings reports can trigger sharp price spikes or drops, prompting traders to modify their charts and indicators accordingly. Therefore, staying updated on news is crucial for effective technical analysis in day trading.
Learn about The Impact of Market News on Technical Analysis
How can backtesting improve day trading strategies based on technical analysis?
Backtesting allows day traders to evaluate their strategies using historical data, identifying which technical analysis indicators and patterns are most effective. By simulating trades based on past market conditions, traders can refine their entry and exit points, optimize risk management, and improve win rates. This process reveals the strengths and weaknesses of a strategy, enabling adjustments before risking real capital. Ultimately, backtesting enhances confidence in a trading plan by providing data-driven insights and increasing the likelihood of consistent profits in live trading scenarios.
Learn about How to Use Backtesting to Improve Your Day Trading Performance
Conclusion about Advanced Technical Analysis Techniques for Day Traders
Incorporating advanced technical analysis techniques can significantly enhance day trading strategies. Mastery of candlestick patterns, moving averages, and Fibonacci retracements empowers traders to make informed decisions. Utilizing momentum indicators, volume analysis, and support and resistance levels further refines market entry and exit points. By leveraging chart patterns, oscillators, and multiple time frame analysis, traders can better predict price movements and manage risk effectively. Understanding the impact of news and employing backtesting are also crucial for optimizing strategies. For comprehensive support and insights, DayTradingBusiness is your go-to resource in navigating these advanced trading techniques.
Learn about Advanced Techniques for Indicator Analysis in Day Trading