Did you know that market sentiment can swing faster than your neighbor’s cat chasing a laser pointer? Understanding sentiment indicators is key for day traders looking to capitalize on market psychology. This article dives into what sentiment indicators are and how they influence trading decisions. You'll learn about the various types of sentiment indicators, tools for analysis, and the impact of news and social media. Discover strategies to combine sentiment with technical analysis, measure market sentiment effectively, and manage trading risks. Plus, we’ll explore the limitations of these indicators and how to interpret changes throughout the trading day. Join DayTradingBusiness as we unravel the mysteries of sentiment indicators and enhance your trading game!
What Are Sentiment Indicators in Day Trading?
Sentiment indicators in day trading reflect the mood of traders and investors toward a specific asset or market. Common sentiment indicators include the put/call ratio, the Fear & Greed Index, and social media sentiment analysis.
To interpret them, look for extreme readings: a high put/call ratio suggests bearish sentiment, while a low ratio indicates bullish sentiment. The Fear & Greed Index shows market emotions; high greed suggests a potential correction, while high fear could indicate buying opportunities. Analyzing social media sentiment helps gauge public opinion; positive trends may signal bullish momentum, while negativity can foreshadow sell-offs.
Use these indicators to inform your trades, looking for discrepancies between sentiment and price action to identify potential reversals or continuations.
How Do I Use Sentiment Indicators to Make Trading Decisions?
To use sentiment indicators for day trading, follow these steps:
1. Identify Key Indicators: Look for popular sentiment indicators like the Fear & Greed Index, trader surveys, and social media sentiment analysis.
2. Analyze Market Mood: Gauge whether the market sentiment is bullish (optimistic) or bearish (pessimistic). High bullish sentiment can indicate overbought conditions, while high bearish sentiment may suggest oversold conditions.
3. Cross-Reference Data: Combine sentiment analysis with technical indicators. For example, if sentiment is bullish but your technical indicators show resistance, consider caution in your trades.
4. Watch for Divergences: Look for discrepancies between price movements and sentiment. If prices rise but sentiment drops, it could signal a reversal.
5. React Quickly: Day trading requires fast decisions. Use sentiment shifts to inform your entries and exits, adjusting your strategy as sentiment changes throughout the day.
6. Stay Updated: Regularly monitor news and events that can impact market sentiment, as they can lead to sudden shifts in trader behavior.
By effectively interpreting sentiment indicators, you can enhance your day trading strategy and make more informed decisions.
Why Are Sentiment Indicators Important for Day Traders?
Sentiment indicators are crucial for day traders because they provide real-time insights into market psychology. By gauging the overall mood—whether bullish or bearish—traders can make informed decisions. For example, high bullish sentiment might signal a buying opportunity, while extreme bearish sentiment could suggest it’s time to sell.
Interpreting these indicators helps traders anticipate potential price movements, align with the market trend, and manage risk effectively. Tools like the Fear and Greed Index or social media sentiment analysis can reveal shifts that traditional indicators might miss. Ultimately, sentiment indicators enhance a trader's ability to navigate volatile markets and capitalize on quick price fluctuations.
What Are the Most Common Types of Sentiment Indicators?
The most common types of sentiment indicators for day trading include:
1. Bullish/Bearish Sentiment Surveys: These gauge trader sentiment, indicating whether the majority is optimistic (bullish) or pessimistic (bearish).
2. Put/Call Ratio: This measures the volume of put options versus call options. A high ratio suggests bearish sentiment, while a low ratio indicates bullish sentiment.
3. Market Breadth Indicators: Metrics like the Advance/Decline Line show the number of stocks advancing versus declining, reflecting overall market sentiment.
4. Volatility Index (VIX): Often referred to as the "fear index," a rising VIX signals increasing fear and bearish sentiment.
5. Social Media Sentiment Analysis: Tools analyze mentions and sentiment on platforms like Twitter to gauge public sentiment toward specific stocks or the market.
Understanding these indicators helps traders assess market mood and make informed decisions.
How Can I Measure Market Sentiment Effectively?
To measure market sentiment effectively for day trading, focus on these key indicators:
1. Social Media Analysis: Monitor platforms like Twitter and Reddit for real-time sentiment. Look for spikes in mentions or hashtags related to specific stocks.
2. News Sentiment: Use news aggregators to track headlines and sentiment scores. Positive or negative news can significantly impact market behavior.
3. Technical Indicators: Pay attention to the Fear and Greed Index, which quantifies sentiment. Also, consider the put-call ratio to gauge market sentiment towards bullish or bearish positions.
4. Volume Analysis: Analyze trading volume alongside price movement. High volume on price increases indicates bullish sentiment, while high volume on declines suggests bearish sentiment.
5. Surveys and Polls: Use sentiment surveys like the AAII Sentiment Survey to gauge investor outlook directly.
Combine these methods for a comprehensive view of market sentiment to inform your day trading strategies.
What Tools Are Available for Analyzing Sentiment Indicators?

For analyzing sentiment indicators in day trading, consider these tools:
1. Social Media Analytics: Platforms like Twitter and StockTwits provide real-time sentiment analysis based on user posts and trends.
2. Sentiment Analysis Software: Tools like MarketPsych and SentimentTrader analyze news articles, social media, and financial reports to gauge market sentiment.
3. Technical Indicators: Use tools like the Fear & Greed Index or the Commitment of Traders (COT) report to assess market sentiment from a technical perspective.
4. News Aggregators: Services like Benzinga and Seeking Alpha curate news to identify bullish or bearish sentiment quickly.
5. Brokerage Platforms: Many trading platforms offer built-in sentiment indicators and reports that summarize trader positions and market mood.
Choose the tool that best suits your trading style and needs.
How Do News Events Impact Sentiment Indicators?
News events significantly impact sentiment indicators by shaping trader perceptions and market emotions. Positive news can boost sentiment, leading to increased buying pressure, while negative news often results in fear and selling. For day trading, monitor key news releases; strong earnings reports, economic data, or geopolitical developments can shift sentiment quickly. Analyze sentiment indicators like the Fear & Greed Index or social media trends alongside news to gauge market reactions. Understanding this interplay helps traders make informed decisions based on current market sentiment.
What Role Does Social Media Play in Sentiment Analysis?
Social media plays a crucial role in sentiment analysis by providing real-time data on public opinion and emotional reactions to stocks or market trends. Traders analyze posts, comments, and hashtags to gauge market sentiment, which can indicate bullish or bearish trends. Tools like natural language processing help quantify sentiment from this unstructured data, allowing day traders to make informed decisions based on prevailing emotions. For instance, a surge in positive tweets about a company might signal potential price increases, while negative comments could suggest declines. Understanding these sentiment indicators can enhance trading strategies and improve timing in the market.
How Can I Combine Sentiment Indicators with Technical Analysis?
To combine sentiment indicators with technical analysis for day trading, start by identifying key sentiment metrics like the Fear & Greed Index or social media sentiment. Use these indicators to gauge market mood.
Next, analyze price charts for patterns and signals—look for support and resistance levels, moving averages, or RSI. When sentiment is bullish and technical indicators show a breakout, consider taking a long position. Conversely, if sentiment is bearish and technical analysis indicates resistance, think about shorting.
Always confirm signals with volume analysis; increased volume on a breakout adds strength to the move. Finally, maintain a risk management strategy to protect against false signals.
What Are the Limitations of Using Sentiment Indicators?
Sentiment indicators can be misleading due to their lagging nature, often reflecting past data rather than current market conditions. They may not account for sudden news events or changes in market sentiment, leading to false signals. Additionally, sentiment can be driven by emotions rather than fundamentals, causing volatility. Overreliance on these indicators can result in poor decision-making, especially when market trends shift unexpectedly. It's essential to combine sentiment indicators with other technical and fundamental analysis tools for more accurate day trading insights.
How Often Should I Check Sentiment Indicators When Trading?
Check sentiment indicators multiple times throughout the day while day trading. Aim for at least every hour or whenever you notice significant market movements. This helps you stay updated on market sentiment changes that can impact your trades. Adjust your frequency based on volatility and trading volume—more volatile markets may require more frequent checks.
How Can I Interpret Sentiment Changes During Market Hours?
To interpret sentiment changes during market hours, focus on real-time indicators like social media trends, news sentiment analysis, and trading volume. Monitor platforms like Twitter and Reddit for shifts in trader sentiment. Use sentiment analysis tools to gauge the mood around specific stocks. Pay attention to unusual trading volumes—spikes can indicate growing interest or panic. Combine these insights with technical analysis to confirm trends. Lastly, stay updated on economic news that could influence market sentiment.
What Are Bullish and Bearish Sentiment Indicators?
Bullish sentiment indicators signal optimism in the market, suggesting that prices will rise. Common examples include rising stock prices, increasing trading volume, and positive news about a company or sector.
Bearish sentiment indicators indicate pessimism, predicting a price decline. Examples include falling stock prices, decreasing volume, and negative news.
For day trading, interpret bullish signals as potential buy opportunities and bearish signals as sell or short opportunities. Always consider combining these indicators with other technical analysis tools for better decision-making.
How Do I Identify Divergences Between Price and Sentiment Indicators?
To identify divergences between price and sentiment indicators in day trading, follow these steps:
1. Select Indicators: Use sentiment indicators like the Put/Call Ratio or the Fear & Greed Index alongside price charts.
2. Analyze Price Action: Look for price trends—higher highs or lower lows.
3. Check Sentiment Trends: Compare sentiment readings during these price movements. For example, if price makes a new high but sentiment is decreasing, that’s a bearish divergence.
4. Confirm with Volume: Validate divergences with trading volume. Low volume on price highs suggests weakness.
5. Use Multiple Timeframes: Check divergences on different timeframes for stronger signals.
6. Watch for Triggers: Look for entry or exit signals when divergences appear, such as candlestick patterns or breakouts.
By combining these methods, you can effectively spot divergences that may indicate potential reversals or continuations in price trends.
How Can Sentiment Indicators Help Manage Trading Risks?
Sentiment indicators help manage trading risks by providing insights into market psychology. They gauge the overall mood of traders, revealing whether the market is bullish or bearish. For day trading, high bullish sentiment might signal a good time to enter a long position, while extreme bearish sentiment could suggest it's time to sell or go short.
By interpreting these indicators, traders can align their strategies with prevailing market sentiment, reducing the risk of unexpected price movements. For instance, if sentiment shifts suddenly, it could indicate a reversal, prompting traders to adjust their positions quickly. This proactive approach allows for better risk management and improved decision-making.
What Strategies Can I Use to Trade Based on Sentiment?
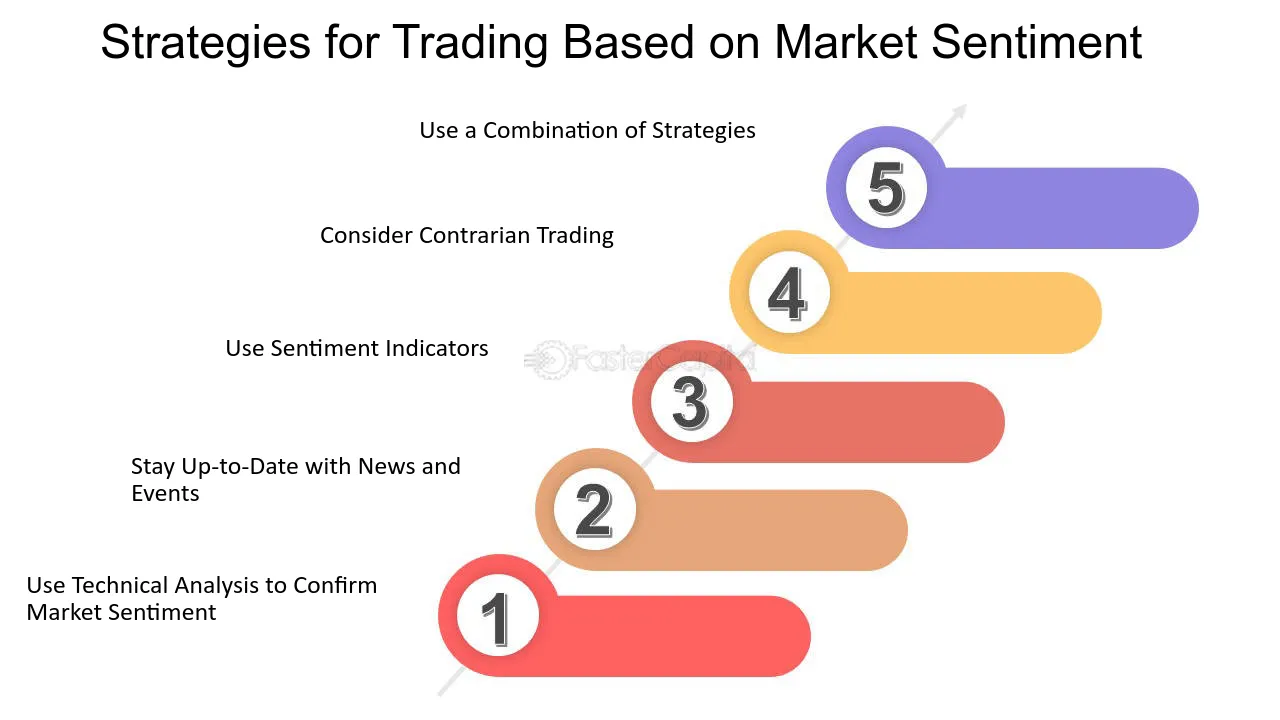
To trade based on sentiment, consider these strategies:
1. Monitor News Trends: Use news aggregators to track headlines and market sentiment. Positive news can drive prices up, while negative news can lead to declines.
2. Social Media Analysis: Analyze platforms like Twitter or Reddit for trending topics. High volumes of mentions can indicate bullish or bearish sentiment.
3. Sentiment Indicators: Use tools like the Fear & Greed Index or put/call ratios. A high fear level might signal a buying opportunity, while extreme greed could suggest a sell.
4. Sentiment in Price Action: Look for price patterns and volume spikes that correlate with sentiment shifts. For example, a price rise on high volume may confirm bullish sentiment.
5. Engagement Metrics: Track engagement on financial forums and trading platforms. Increased engagement often predicts price movements based on trader sentiment.
6. Surveys and Polls: Keep an eye on sentiment surveys from traders and analysts. These can provide insights into broader market mood.
7. Combine with Technical Analysis: Use sentiment data alongside technical indicators to confirm signals. This can enhance your trading decisions.
Utilize these strategies to effectively interpret sentiment indicators for day trading.
Conclusion about How to Interpret Sentiment Indicators for Day Trading
Interpreting sentiment indicators is crucial for making informed trading decisions in the fast-paced world of day trading. By understanding market sentiments, traders can better anticipate price movements and identify potential opportunities. While sentiment indicators offer valuable insights, it's essential to combine them with technical analysis and remain aware of their limitations. Regularly monitoring these indicators alongside news events and social media trends can enhance your overall trading strategy. For more in-depth guidance on utilizing sentiment indicators effectively, consider exploring the resources available at DayTradingBusiness.
Learn about How to Interpret Backtesting Results for Day Trading