Did you know that even the best day traders can sometimes feel like they're trying to read hieroglyphics? Understanding day trading patterns, however, doesn't have to be a mystery. This article dives into the essential day trading patterns for beginners, covering everything from identifying bullish and bearish trends to the role of candlestick patterns. You'll learn about support and resistance levels, reversal patterns, and how trend lines can aid in recognizing trading patterns. We'll also explore vital indicators, the impact of volume patterns, and the importance of continuation patterns. Additionally, psychological factors, the influence of news events, and the tools for pattern analysis will be discussed, topped off with tips on practicing recognition and common pitfalls to avoid. With insights from DayTradingBusiness, you'll be better equipped to navigate the dynamic world of day trading.
What Are the Most Common Day Trading Patterns for Beginners?
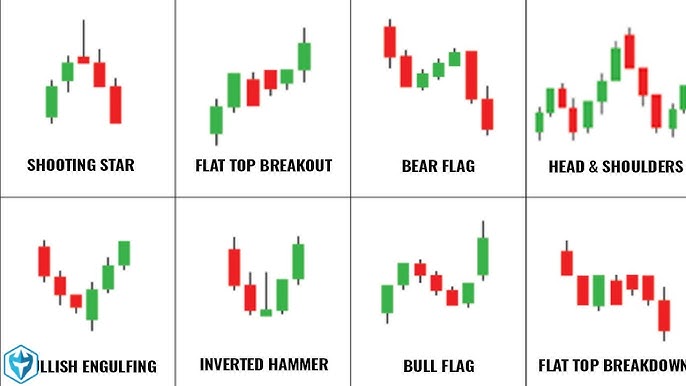
The most common day trading patterns for beginners include:
1. Bull Flag: A sharp price rise followed by a consolidation phase, indicating a potential continuation upward.
2. Bear Flag: A sharp price drop followed by a consolidation, suggesting a potential continuation downward.
3. Head and Shoulders: A reversal pattern that signals a potential trend change from bullish to bearish after three peaks.
4. Double Top: A bearish reversal pattern formed after a price reaches a peak twice, failing to break higher.
5. Double Bottom: A bullish reversal pattern where the price hits a low twice, indicating a potential trend reversal upward.
6. Cup and Handle: A bullish continuation pattern where the price forms a rounded bottom (cup) followed by a consolidation (handle) before breaking out.
7. Ascending Triangle: A bullish continuation pattern formed by higher lows and a horizontal resistance line, indicating a potential breakout.
8. Descending Triangle: A bearish continuation pattern with lower highs and a horizontal support line, suggesting a potential breakdown.
Familiarizing yourself with these patterns can help you identify trading opportunities effectively.
How Can I Identify Bullish and Bearish Patterns?
To identify bullish patterns, look for formations like higher highs and higher lows, flags, pennants, and double bottoms. Bullish engulfing candles also signal potential upward trends. For bearish patterns, watch for lower highs and lower lows, head and shoulders, and double tops. Bearish engulfing candles indicate possible downward movement. Use volume analysis to confirm these patterns; increased volume often validates a trend. Practice recognizing these patterns on charts to improve your skills in day trading.
What Role Do Candlestick Patterns Play in Day Trading?
Candlestick patterns are crucial in day trading as they help traders identify market sentiment and potential price movements. Patterns like dojis, hammers, and engulfing candles signal reversals or continuations, guiding entry and exit points. By analyzing these formations, traders can make informed decisions, increasing their chances of profitability in short time frames. Recognizing these patterns enhances a trader's ability to anticipate market behavior, making candlestick analysis a fundamental tool in day trading strategies.
How Do Support and Resistance Levels Affect Trading Patterns?
Support and resistance levels are crucial in day trading as they indicate price points where stocks tend to reverse direction. Support is where buying interest overcomes selling pressure, preventing prices from falling further. Resistance is where selling pressure surpasses buying interest, capping price increases. Traders use these levels to identify entry and exit points. For example, if a stock approaches support, traders might buy, anticipating a bounce. Conversely, if it hits resistance, they may sell or short, expecting a decline. Understanding these patterns helps traders make informed decisions and manage risks effectively.
What Are Reversal Patterns and How Do They Work?
Reversal patterns are chart formations that indicate a potential change in the direction of a stock's price. They signal that a trend—either bullish or bearish—may be ending, and a new trend might begin. Common reversal patterns include head and shoulders, double tops and bottoms, and triangles.
To use reversal patterns in day trading, watch for these formations on price charts. For example, a head and shoulders pattern forms after an uptrend and suggests a shift to a downtrend. Traders typically enter a position once the pattern confirms, often indicated by a breakout through key support or resistance levels. It’s crucial to use stop-loss orders to manage risk, as not all patterns lead to reversals.
How Can Trend Lines Help in Recognizing Trading Patterns?
Trend lines help in recognizing trading patterns by visually representing the direction of price movements. They connect significant highs or lows on a chart, making it easier to identify bullish or bearish trends. By analyzing these lines, traders can spot potential entry and exit points. For beginners, drawing trend lines can clarify market sentiment and highlight support and resistance levels. This simplification enables more informed trading decisions and enhances pattern recognition in day trading.
What Indicators Should Beginners Use to Spot Patterns?
Beginners should use these key indicators to spot patterns in day trading:
1. Moving Averages (MA): Look for the crossover of short-term and long-term MAs to identify trends.
2. Relative Strength Index (RSI): An RSI above 70 indicates overbought conditions, while below 30 suggests oversold.
3. Volume: Increased volume during price movements confirms the strength of a pattern.
4. Bollinger Bands: Price touching the upper band may signal overbought conditions, while touching the lower band indicates oversold.
5. MACD (Moving Average Convergence Divergence): Use MACD crossovers to identify potential buy or sell signals.
These indicators help beginners recognize day trading patterns effectively.
How Do Volume Patterns Impact Day Trading Decisions?
Volume patterns significantly impact day trading decisions by indicating the strength or weakness of price movements. High volume often confirms trends, while low volume may suggest a lack of conviction. Traders look for volume spikes to identify potential breakouts or reversals. For instance, if a stock rises on high volume, it signals buying interest, prompting traders to enter positions. Conversely, if price increases with declining volume, it may indicate a potential pullback, leading traders to reconsider their strategy. Understanding these patterns helps day traders make informed decisions, manage risk, and enhance profitability.
What Are Continuation Patterns and Why Are They Important?
Continuation patterns are chart formations that suggest a trend will continue after a brief pause. Common types include flags, pennants, and triangles. They are important because they help traders identify potential entry points for trades aligned with the prevailing trend, increasing the chances of successful trades. Recognizing these patterns allows day traders to make informed decisions and manage risk effectively.
How Can I Use Chart Patterns to Improve My Trading Strategy?
To improve your trading strategy using chart patterns, start by studying key patterns like head and shoulders, double tops, and flags. Identify these patterns on your charts to anticipate potential price movements. Use them to set entry and exit points, placing stop-loss orders to manage risk. Regularly practice recognizing these patterns in real-time to build confidence. Combine chart patterns with volume analysis for stronger signals. Finally, keep a trading journal to track your trades and refine your approach based on what works best for you.
Learn about How to Use Chart Patterns for Day Trading Analysis
What Psychological Factors Influence Day Trading Patterns?
Psychological factors that influence day trading patterns include fear, greed, overconfidence, and loss aversion. Fear can lead to hasty sell-offs, while greed may encourage risky trades. Overconfidence often results in traders ignoring market signals, and loss aversion can cause hesitation in closing losing positions. Additionally, social influences, such as following trends or peer behavior, can impact decision-making.
How Do News Events Affect Day Trading Patterns?
News events can significantly impact day trading patterns by causing volatility and influencing stock prices. Positive news can lead to rapid price increases, prompting traders to buy, while negative news may trigger sell-offs. Economic reports, earnings releases, and geopolitical events often create sharp movements, allowing day traders to capitalize on quick price changes. Traders typically monitor news feeds and use this information to make split-second decisions that align with market sentiment. Understanding how to interpret news can enhance day trading strategies and improve profitability.
Learn about How News Events Impact Day Trading Decisions
What Tools Are Best for Analyzing Day Trading Patterns?
The best tools for analyzing day trading patterns include:
1. Charting Software: Platforms like TradingView and Thinkorswim offer advanced charting capabilities and technical indicators.
2. Stock Screeners: Use Finviz or Trade Ideas to filter stocks based on volume, price action, and technical setups.
3. Technical Analysis Tools: Tools like MetaTrader or NinjaTrader provide in-depth analysis and backtesting features.
4. News Aggregators: Services like Benzinga or MarketWatch keep you updated on market-moving news.
5. Social Trading Platforms: Websites like eToro allow you to follow and learn from experienced traders.
These tools will help you effectively analyze and identify day trading patterns.
Learn about Best Tools for Day Trading Backtesting
How Can I Practice Recognizing Patterns Before Trading?
To practice recognizing patterns before day trading, start by studying charts of past trades. Use tools like ThinkorSwim or TradingView to analyze historical price movements. Focus on common patterns like flags, triangles, and head and shoulders.
Try paper trading to simulate real trades without financial risk; this helps reinforce your pattern recognition skills. Join trading communities or forums to discuss patterns with others. Regularly review your trades to identify what worked and what didn’t. Consistent practice will enhance your ability to spot patterns effectively.
What Mistakes Should Beginners Avoid When Trading Patterns?
Beginners should avoid these common mistakes when trading patterns:
1. Ignoring Volume: Always check volume when trading patterns; low volume can signal false breakouts.
2. Lack of a Trading Plan: Have a clear strategy for entry, exit, and risk management before making trades.
3. Overtrading: Don't chase every pattern; focus on high-quality setups to avoid unnecessary losses.
4. Disregarding Market Context: Understand the broader market trends; patterns can behave differently in various conditions.
5. Emotional Trading: Stick to your plan and avoid making impulsive decisions based on fear or greed.
6. Relying Solely on Patterns: Combine pattern recognition with other indicators for better confirmation.
7. Neglecting Stop Losses: Always use stop losses to protect your capital and manage risk effectively.
How Do Time Frames Influence Day Trading Patterns?

Time frames significantly influence day trading patterns by determining the frequency and type of trades a trader executes. Shorter time frames, like 1-minute or 5-minute charts, focus on rapid price movements and quick trades, leading to patterns like scalping. Longer time frames, such as 15-minute or hourly charts, allow for more significant price swings and strategic entries, creating patterns based on trends rather than noise.
Traders often adapt their strategies based on their chosen time frame, affecting their risk management and profit targets. For beginners, understanding how time frames impact volatility and liquidity is crucial for developing effective day trading strategies.
Learn about How Liquidity and Depth Influence Day Trading Decisions
Conclusion about Understanding Day Trading Patterns for Beginners
In conclusion, mastering day trading patterns is essential for any beginner looking to enhance their trading strategy. By understanding bullish and bearish patterns, utilizing candlestick formations, and recognizing support and resistance levels, traders can make informed decisions. Incorporating trend lines, volume analysis, and psychological insights further refines pattern recognition. Remember, practice is crucial, and avoiding common mistakes can lead to more successful trades. Embrace the resources offered by DayTradingBusiness to deepen your knowledge and improve your trading skills.
Learn about Understanding Candlestick Patterns in Day Trading