Did you know some traders believe they can communicate with their charts? While we can't guarantee that, we can assure you that mastering pattern analysis tools is crucial for day trading success. This article dives into the best pattern analysis tools available, how to use them effectively, and essential features to look for in software. We’ll explore free options, the importance of pattern recognition, and the types of patterns to focus on. Additionally, we’ll highlight common mistakes traders make and compare chart patterns with technical indicators. With insights on automated tools and candlestick patterns, this guide from DayTradingBusiness will help you refine your trading strategies and improve your market predictions.
What are the best pattern analysis tools for day traders?
The best pattern analysis tools for day traders include:
1. TradingView: Offers advanced charting and a wide range of technical indicators for pattern recognition.
2. MetaTrader 4/5: Popular for its customizable indicators and expert advisors for automated pattern analysis.
3. NinjaTrader: Provides extensive tools for backtesting strategies and analyzing market patterns.
4. Thinkorswim: Features advanced charting tools and pattern recognition capabilities for real-time analysis.
5. StockCharts: Known for its user-friendly interface and comprehensive charting tools.
These tools help identify trends, reversals, and other critical patterns essential for day trading success.
How do day traders use pattern analysis tools effectively?
Day traders use pattern analysis tools effectively by identifying price patterns, such as flags, pennants, and head and shoulders, to predict future movements. They apply technical indicators like moving averages and RSI to confirm patterns and determine entry and exit points. Utilizing charting software, traders analyze past price action to spot trends and reversals quickly. They also set alerts for specific patterns, enabling timely trades. Consistent practice and backtesting strategies with these tools enhance their decision-making and risk management.
What features should I look for in pattern analysis software?
Look for real-time data analysis, customizable charting tools, and advanced pattern recognition algorithms. Ensure it supports multiple indicators and overlays for comprehensive analysis. Good software should offer backtesting capabilities to evaluate strategies and include alerts for specific patterns. User-friendly interfaces and integration with trading platforms are also essential for day traders.
Are there free pattern analysis tools available for day trading?
Yes, there are several free pattern analysis tools for day trading. Popular options include TradingView, which offers a variety of charting tools and indicators, and Thinkorswim by TD Ameritrade, which provides advanced chart analysis features. Other free tools like StockCharts and Yahoo Finance also offer basic pattern recognition capabilities. These platforms can help you identify trends and patterns without any cost.
How can pattern recognition improve day trading strategies?
Pattern recognition enhances day trading strategies by identifying trends and signals in price movements. Traders use tools like chart patterns, candlestick formations, and technical indicators to spot entry and exit points. Recognizing patterns such as head and shoulders or flags helps traders anticipate market behavior and make informed decisions. This approach increases the probability of profitable trades and minimizes risks. By analyzing historical data, traders can refine their strategies and adapt to changing market conditions, ultimately improving their overall performance.
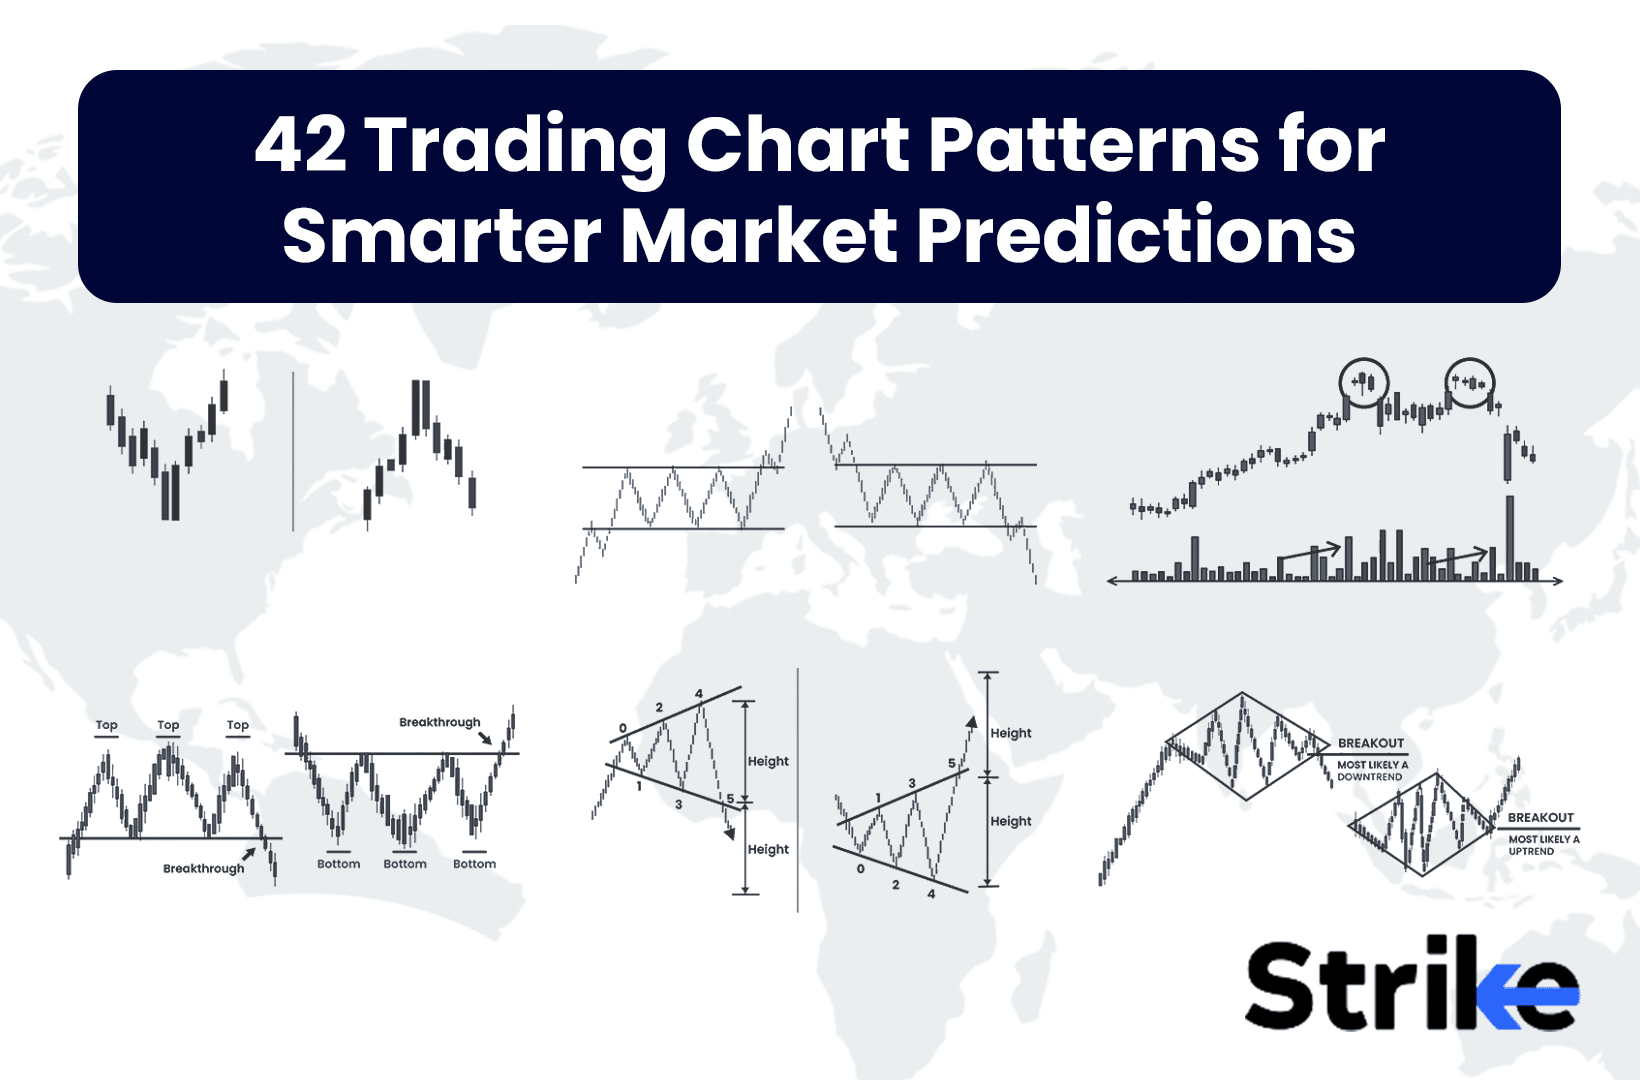
What types of patterns should day traders focus on?
Day traders should focus on patterns like flags, triangles, head and shoulders, and double tops/bottoms. These patterns indicate potential price movements and can help identify entry and exit points. Additionally, keep an eye on candlestick patterns such as dojis and hammers, as they signal market sentiment shifts. Volume analysis alongside these patterns enhances decision-making by confirming trends or reversals.
How do I choose the right pattern analysis tool for my trading style?

To choose the right pattern analysis tool for day trading, consider these factors:
1. Trading Style: Identify if you prefer scalping, momentum trading, or swing trading. Different tools excel in different styles.
2. Features: Look for tools that offer real-time data, customizable charts, and specific pattern recognition capabilities relevant to your strategy.
3. User Interface: Ensure the tool is user-friendly. A cluttered interface can slow you down during trades.
4. Integration: Check if the tool integrates with your trading platform for seamless execution.
5. Backtesting: Choose a tool that allows you to backtest patterns against historical data to validate your strategies.
6. Cost: Assess your budget. Some tools offer advanced features at a premium, while others may provide adequate functionality for free.
7. Community and Support: Look for tools with strong community support and resources for learning, which can enhance your trading knowledge.
Evaluate a few options based on these criteria to find the best fit for your trading style.
What are the advantages of automated pattern analysis tools?
Automated pattern analysis tools offer day traders faster decision-making, eliminating the need for manual pattern recognition. They identify trends and signals in real-time, increasing the accuracy of trades. These tools can analyze vast amounts of data quickly, helping traders spot opportunities that might be missed otherwise. They also reduce emotional bias by relying on data-driven insights. Additionally, many tools provide customizable alerts, so traders stay informed about market movements without constant monitoring. Overall, they enhance efficiency and effectiveness in trading strategies.
How can I interpret patterns using day trading software?

To interpret patterns using day trading software, focus on these key tools:
1. Charting Features: Use candlestick charts to identify price patterns like flags, head and shoulders, or triangles.
2. Technical Indicators: Apply indicators like Moving Averages, RSI, and MACD to spot trends and reversals.
3. Volume Analysis: Check volume spikes alongside price movements to confirm patterns' strength.
4. Pattern Recognition Tools: Utilize software that automatically detects patterns and signals potential trades.
5. Backtesting: Test identified patterns against historical data to evaluate their reliability.
6. Real-Time Alerts: Set alerts for when certain patterns form, helping you act quickly.
By combining these tools, you can effectively interpret patterns and make informed trading decisions.
What common mistakes do traders make with pattern analysis?
Traders often make several common mistakes with pattern analysis. First, they rely too heavily on historical patterns without considering current market conditions. Many overlook the importance of volume, which can validate or invalidate a pattern. Traders frequently misinterpret patterns, mistaking random price movements for recognizable formations. Additionally, they may ignore proper risk management, leading to larger losses when a pattern fails. Relying solely on one type of pattern and neglecting to diversify their analysis can also limit their effectiveness. Lastly, emotional decision-making can cloud judgment, causing traders to act impulsively rather than sticking to their analysis.
How do chart patterns differ from technical indicators in day trading?
Chart patterns are formations created by price movements on a chart, like head and shoulders or triangles, indicating potential future price action. Technical indicators, on the other hand, are mathematical calculations based on price and volume, like moving averages or RSI, used to identify trends or reversals.
In day trading, chart patterns focus on visual signals and market psychology, while technical indicators provide numerical data to confirm or support trading decisions. Both tools serve different purposes; patterns suggest entry and exit points, whereas indicators help assess momentum and market conditions.
Learn about How to Use Technical Indicators with Day Trading Patterns
Can pattern analysis tools predict market trends accurately?
Yes, pattern analysis tools can predict market trends accurately, especially for day traders. By identifying historical price patterns and trends, these tools help traders make informed decisions. However, their effectiveness depends on market conditions and the trader's interpretation. Using a combination of technical indicators and real-time data enhances accuracy.
Learn about Using Sentiment Analysis to Predict Market Trends
What are the limitations of using pattern analysis in trading?
Pattern analysis in trading has several limitations. First, it relies on historical data, which may not predict future movements accurately. Market conditions can change abruptly, rendering past patterns less relevant. Second, patterns can be subjective; different traders may interpret them in various ways, leading to inconsistent results. Third, false signals can occur, causing traders to make poor decisions based on misleading patterns. Finally, it often ignores fundamental analysis, which can significantly impact market behavior.
How often should I update my pattern analysis techniques?
Update your pattern analysis techniques every few months or as market conditions change significantly. Regularly review your tools and strategies after major market shifts or when you notice consistent underperformance. Stay informed about new tools and trends in day trading to adapt quickly.
What role do candlestick patterns play in day trading?
Candlestick patterns are crucial in day trading as they provide visual insights into price movements and market sentiment. Traders use these patterns to identify potential reversals or continuations in trends. For instance, a bullish engulfing pattern may signal a buying opportunity, while a bearish harami might indicate a sell signal. By analyzing these patterns, traders can make more informed decisions about entry and exit points, enhancing their overall strategy.
How can I combine pattern analysis with other trading strategies?
To combine pattern analysis with other trading strategies, start by identifying key patterns in price movements, such as head and shoulders, flags, or triangles. Use these patterns to set entry and exit points. Next, integrate technical indicators like RSI or MACD to confirm signals from your patterns, enhancing decision-making.
Also, consider using volume analysis alongside pattern recognition; increased volume can validate a breakout or trend reversal. Additionally, implement risk management techniques, such as stop-loss orders, to protect against false signals. Lastly, backtest your combined strategy to ensure effectiveness before applying it in live trading.
Learn about How to Combine Sentiment Analysis with Trading Strategies
Conclusion about Pattern Analysis Tools for Day Traders
Incorporating pattern analysis tools into your day trading strategy can significantly enhance your trading decisions and outcomes. By choosing the right software and understanding both the advantages and limitations, you can improve your market predictions and minimize mistakes. Remember to regularly update your techniques and combine pattern analysis with other strategies for optimal results. With the right approach, you can harness the full potential of these tools to elevate your trading game, as highlighted by DayTradingBusiness.
Learn about Best Technical Analysis Tools for Day Traders
Sources:
- A profitable trading algorithm for cryptocurrencies using a Neural ...
- Pro Trader RL: Reinforcement learning framework for generating ...
- Evolving Financial Trading Strategies with Vectorial Genetic ...
- Speech by Governor Brainard on the structure of the Treasury ...
- Machine learning techniques and data for stock market forecasting ...
- Fuzzy modeling of stock trading with fuzzy candlesticks - ScienceDirect