Did you know that chart patterns can sometimes feel like reading tea leaves? While they might not predict your future, they are essential for day traders looking to navigate the markets effectively. In this article, we'll explore the key chart patterns every day trader should know, from identifying bullish and bearish signals to understanding the significance of head and shoulders patterns. We'll also discuss how trend lines and candlestick patterns enhance your analysis, the importance of volume, and tips for spotting reversal and continuation patterns. Additionally, we'll cover common mistakes to avoid, resources for learning, and the impact of market context on pattern reliability. With insights from DayTradingBusiness, you'll be well-equipped to refine your trading strategy and make informed decisions.
What are the most important chart patterns for day trading?
The most important chart patterns for day trading include:
1. Head and Shoulders: Indicates a reversal in trend.
2. Double Top and Double Bottom: Signals potential reversals after a trend.
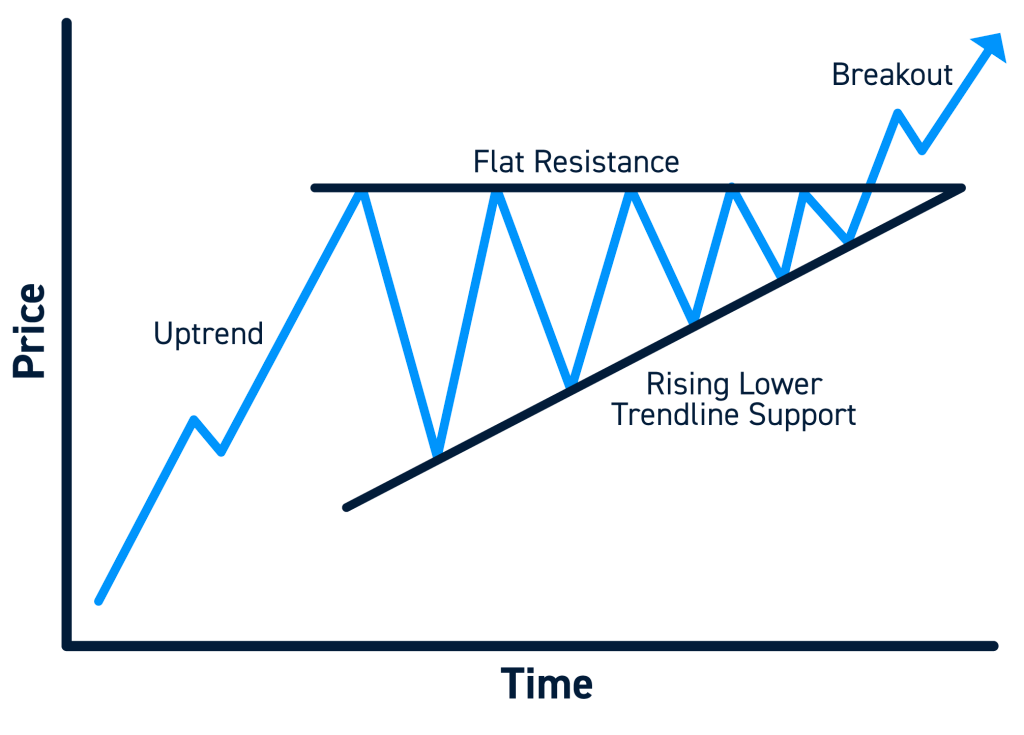
3. Triangles (Ascending, Descending, Symmetrical): Shows consolidation and potential breakout directions.
4. Flags and Pennants: Represents continuation patterns after a strong price movement.
5. Cup and Handle: Suggests bullish continuation.
Focus on these patterns to identify entry and exit points effectively.
How can I identify bullish and bearish chart patterns?
To identify bullish chart patterns, look for formations like ascending triangles, double bottoms, and cup and handle patterns. These indicate potential price increases. For bearish patterns, watch for descending triangles, double tops, and head and shoulders. These suggest possible price declines. Use volume analysis to confirm these patterns; increasing volume with bullish patterns indicates strength, while decreasing volume with bearish patterns suggests weakness. Always combine pattern recognition with other technical indicators for better accuracy.
What is the significance of the head and shoulders pattern?
The head and shoulders pattern signals a potential trend reversal. It forms after an uptrend and consists of three peaks: a higher peak (head) between two lower peaks (shoulders). This pattern indicates that buying momentum is weakening, suggesting a shift to a downtrend. Traders often look for confirmation through volume and a breakout below the neckline to execute sell orders. It's crucial for identifying market shifts and managing risk.
How do I trade using the double top and double bottom patterns?
To trade using double top and double bottom patterns, follow these steps:
Double Top:
1. Identify the pattern after an uptrend, where the price peaks at two levels roughly equal in height.
2. Wait for confirmation by seeing the price break below the support level formed by the valley between the two peaks.
3. Enter a short position after the break, aiming for a target based on the height of the peaks minus the breakdown point.
4. Set a stop-loss slightly above the recent high.
Double Bottom:
1. Look for the pattern following a downtrend, where the price dips to two similar lows.
2. Confirm the pattern when the price breaks above the resistance level created by the peak between the two lows.
3. Enter a long position after this breakout, targeting a profit equal to the height of the pattern added to the breakout point.
4. Place a stop-loss just below the recent low.
Use these patterns for clear entry and exit points in your trading strategy.
What are flags and pennants in day trading?
Flags and pennants are continuation chart patterns in day trading that indicate a brief consolidation before the price continues in the direction of the prior trend.
A flag resembles a rectangular shape that slopes against the trend, while a pennant looks like a small symmetrical triangle formed after a strong price movement. Both patterns suggest potential breakout opportunities, with traders often entering positions upon confirmation of the breakout. Understanding these patterns can enhance trading strategies and improve entry and exit points.
How can trend lines help in recognizing chart patterns?
Trend lines help in recognizing chart patterns by visually connecting significant price points, indicating the direction of the market. They identify support and resistance levels, making it easier to spot patterns like triangles, flags, and head and shoulders. By analyzing these lines, traders can forecast potential price movements and make informed decisions based on established trends.
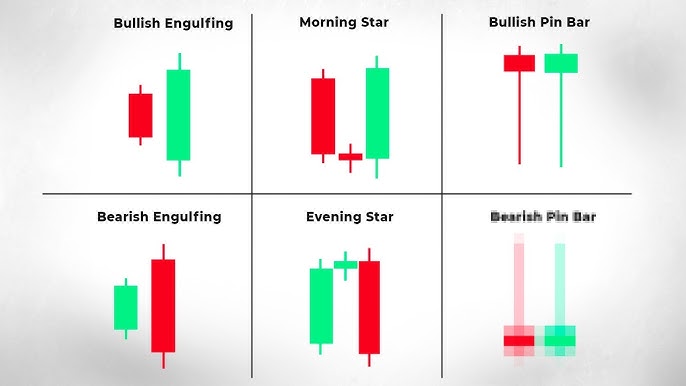
What role do candlestick patterns play in chart analysis?
Candlestick patterns are crucial in chart analysis as they provide visual insights into market sentiment and potential price movements. Each pattern, like dojis or hammers, indicates buying or selling pressure, helping traders identify reversals or continuations. By interpreting these patterns within the context of support and resistance levels, traders can make informed decisions about entry and exit points. Understanding these patterns enhances the ability to predict short-term price action, making them essential for effective day trading.
How do I use the cup and handle pattern effectively?
To use the cup and handle pattern effectively, follow these steps:
1. Identify the Pattern: Look for a rounded bottom (the cup) followed by a consolidation phase (the handle). The cup should ideally take at least 6 weeks to form, and the handle should be shorter.
2. Volume Analysis: Ensure that volume decreases during the cup formation and increases as the price breaks out of the handle.
3. Entry Point: Enter the trade when the price breaks above the handle’s resistance level. This signals bullish momentum.
4. Set Stop-Loss: Place a stop-loss slightly below the handle to minimize potential losses.
5. Target Profit: Aim for a price target based on the depth of the cup, projecting a similar move upwards from the breakout point.
6. Monitor Market Conditions: Keep an eye on overall market trends and news that could impact the stock.
Using these steps increases the likelihood of a successful trade with the cup and handle pattern.
What is the importance of volume in chart patterns?
Volume is crucial in chart patterns because it confirms the strength of a price move. High volume during a breakout indicates strong buying or selling interest, making the move more likely to sustain. Conversely, low volume can suggest a false breakout, signaling caution. For day traders, analyzing volume helps in identifying potential reversals and continuations, enhancing decision-making. In summary, volume provides essential context to chart patterns, guiding traders in assessing market sentiment.
How can I spot reversal patterns in day trading?
To spot reversal patterns in day trading, look for these key chart patterns:
1. Head and Shoulders: This pattern signals a reversal after an uptrend. Look for three peaks: a higher peak (head) between two lower peaks (shoulders).
2. Inverse Head and Shoulders: The opposite of the above, indicating a reversal after a downtrend. It features three troughs with the middle one being the deepest.
3. Double Top: Identify two peaks at roughly the same price level after an uptrend. This suggests a reversal as the price struggles to break the high.
4. Double Bottom: This pattern appears after a downtrend, showing two lows at similar levels. It's a bullish signal indicating potential upward movement.
5. Bullish and Bearish Engulfing Patterns: Look for a smaller candle followed by a larger opposite candle, which can indicate a reversal in the current trend.
6. Doji Candles: A doji indicates indecision in the market. If it appears at the end of a trend, it can signal a potential reversal.
Monitor volume alongside these patterns for confirmation. Higher volume during the formation of these patterns strengthens their reliability.
Learn about How to Spot Reversal Signals on Day Trading Charts
What are continuation patterns and why do they matter?
Continuation patterns are chart formations that indicate the price trend is likely to continue after a brief pause. Examples include flags, pennants, and triangles. They matter because they help day traders identify potential entry points for trades, enabling them to capitalize on existing trends. Recognizing these patterns can enhance decision-making and improve trading outcomes.
How do I combine chart patterns with other technical indicators?
To combine chart patterns with technical indicators, first identify the key chart patterns like head and shoulders, double tops, or flags. Once you spot a pattern, use indicators like moving averages, RSI, or MACD to confirm the trend. For example, if you see a bullish flag pattern, check if the RSI is above 50 to validate upward momentum. Additionally, use volume indicators to ensure that the breakout from the pattern is supported by significant trading volume. This multi-faceted approach increases the reliability of your trades.
What mistakes should I avoid when trading chart patterns?
Avoid these mistakes when trading chart patterns:
1. Ignoring volume: Ensure volume confirms the pattern. A breakout on low volume may indicate a false signal.
2. Overtrading: Don't enter every pattern; wait for high-probability setups that align with your strategy.
3. Misinterpreting patterns: Learn the nuances of each pattern to avoid false interpretations.
4. Neglecting risk management: Always set stop-loss orders to protect your capital.
5. Failing to adapt: Market conditions change; be flexible and adjust your approach as needed.
6. Relying solely on patterns: Use other technical indicators to validate your trades.
How can I practice identifying chart patterns accurately?
To practice identifying key chart patterns accurately, start by studying common patterns like head and shoulders, double tops, and flags. Use charting software to analyze historical price data, focusing on these patterns. Set up a demo trading account to simulate trades based on pattern recognition. Regularly review your trades to see if the patterns led to expected outcomes. Join trading forums or groups to discuss patterns with others and share insights. Lastly, keep a journal of your observations and refine your skills over time.
What resources are available for learning about chart patterns?
To learn about key chart patterns, check out these resources:
1. Books: "Technical Analysis of the Financial Markets" by John Murphy and "How to Trade in Stocks" by Jesse Livermore offer foundational knowledge.
2. Online Courses: Websites like Udemy and Coursera have courses focused on chart patterns and technical analysis.
3. YouTube Channels: Look for channels like "Warrior Trading" and "The Chart Guys" that provide practical tutorials on chart patterns.
4. Trading Forums: Join communities like Elite Trader and Trade2Win to discuss patterns with experienced traders.
5. Charting Software: Tools like TradingView and MetaTrader provide features to practice identifying chart patterns in real-time.
6. Blogs and Articles: Websites like Investopedia and StockCharts frequently publish articles on specific chart patterns and their implications for trading.
These resources will enhance your understanding of chart patterns crucial for day trading success.
How does market context influence the reliability of chart patterns?
Market context significantly impacts the reliability of chart patterns. For instance, patterns like head and shoulders or flags can indicate trend reversals or continuations, but their effectiveness varies based on market conditions. In a volatile market, patterns may fail due to unexpected news or events, while in a stable environment, they tend to perform better. Additionally, the volume accompanying a pattern can validate its reliability; higher volume typically strengthens the signal. Traders should always assess the broader market trends, sentiment, and economic indicators to gauge how these factors might affect chart patterns.
Conclusion about Key Chart Patterns Every Day Trader Should Know
Understanding key chart patterns is essential for successful day trading. Familiarizing yourself with bullish and bearish patterns, such as head and shoulders or double tops and bottoms, can enhance your trading strategy. Recognizing flags, pennants, and candlestick formations adds depth to your analysis. Volume plays a critical role in validating these patterns. By integrating trend lines and other technical indicators, you can improve your decision-making process. Avoid common pitfalls and practice diligently to sharpen your skills. For comprehensive insights and resources on chart patterns, DayTradingBusiness is here to support your trading journey.
Learn about Chart Patterns Every Day Trader Should Know