Did you know that some traders spend more time analyzing charts than they do on their morning coffee? In the fast-paced world of day trading, understanding patterns is crucial for success. This article delves into the most common day trading patterns, including candlestick formations, bullish and bearish indicators, and the importance of volume. Learn how reversal and continuation patterns can signal market changes and how to effectively use support and resistance levels. We'll also explore the role of moving averages, technical indicators, and news events in shaping trading strategies. For beginners, identifying key patterns and avoiding fakeouts can significantly enhance your trading plan. Join DayTradingBusiness as we equip you with essential tools and insights to navigate the dynamic landscape of day trading.
What Are the Most Common Day Trading Patterns?
The most common day trading patterns include:
1. Head and Shoulders: Indicates a reversal trend.
2. Double Top and Double Bottom: Signals potential trend reversals.
3. Flags and Pennants: Continuation patterns that show brief pauses in trends.
4. Triangles: Can indicate continuation or reversal based on breakout direction.
5. Cup and Handle: Suggests a bullish trend after a consolidation period.
Recognizing these patterns can help new traders make informed decisions.
How Do Candlestick Patterns Work in Day Trading?
Candlestick patterns in day trading represent price movements over a specific time frame, helping traders identify potential market reversals or continuations. Each candlestick shows open, close, high, and low prices, creating visual patterns like dojis, hammers, or engulfing patterns. These patterns signal trader sentiment and can indicate buying or selling pressure.
For new traders, recognizing these patterns can help make informed decisions, as they often precede significant price movements. Use them in conjunction with volume and other indicators for better accuracy. Practice identifying patterns on charts to build confidence and effectiveness in day trading.
What Is the Importance of Volume in Day Trading Patterns?
Volume is crucial in day trading patterns because it indicates the strength of a price movement. High volume often signals strong interest and can confirm trends, while low volume may suggest a lack of conviction, making patterns less reliable. For new traders, understanding volume helps in identifying potential reversals and breakouts. It provides context to price movements, allowing traders to make more informed decisions. Always consider volume alongside price action to enhance trading strategies.
How Can I Identify Bullish and Bearish Patterns?
To identify bullish patterns, look for formations like higher highs and higher lows, ascending triangles, and cup-and-handle shapes. For bearish patterns, watch for lower highs and lower lows, descending triangles, and head-and-shoulders formations. Use candlestick patterns like bullish engulfing and bearish engulfing for confirmation. Pay attention to volume—rising volume on bullish patterns and declining volume on bearish patterns can signal strength. Always combine these patterns with support and resistance levels for better accuracy.
What Day Trading Patterns Should Beginners Focus On?
Beginners should focus on these key day trading patterns:
1. Bullish and Bearish Flags: These indicate continuation of trends. Look for flags forming after a strong price movement.
2. Cup and Handle: This signals bullish potential. The cup forms a rounded bottom, and the handle consolidates before a breakout.
3. Head and Shoulders: This reversal pattern indicates a trend change. Look for the three peaks formation.
4. Double Top and Bottom: These patterns signal potential reversals. A double top indicates a bearish reversal, while a double bottom suggests bullish potential.
5. Triangles (Ascending, Descending, Symmetrical): These indicate consolidation and potential breakouts. Watch for price action at the triangle’s apex.
Start by practicing these patterns in a demo account to build confidence and understanding.
How Do Reversal Patterns Signal Market Changes?
Reversal patterns signal market changes by indicating potential trend reversals. For example, a head and shoulders pattern suggests a shift from bullish to bearish sentiment. Similarly, a double bottom pattern often indicates a transition from bearish to bullish. These patterns form at key support and resistance levels, providing traders with entry and exit points. Recognizing these patterns helps traders anticipate price movements and adjust their strategies accordingly.
What Are Continuation Patterns in Day Trading?

Continuation patterns in day trading are chart formations that indicate a trend will likely continue after a brief pause. Common types include flags, pennants, and triangles. These patterns suggest that traders can anticipate price movements in the direction of the prevailing trend, making them potential entry or exit points. For example, an upward flag pattern after a rally signals that the price may soon push higher. Recognizing these patterns helps traders make informed decisions and capitalize on ongoing trends.
How Can Chart Patterns Improve My Trading Strategy?
Chart patterns can significantly enhance your trading strategy by providing visual cues for potential market movements. Patterns like head and shoulders, triangles, and flags signal reversals or continuations, helping you identify entry and exit points. Recognizing these patterns can improve your timing, allowing for better risk management and increasing your chances of profit. By incorporating chart patterns into your day trading, you can make informed decisions based on historical price behavior, which can lead to more consistent results.
What Role Do Support and Resistance Levels Play?
Support and resistance levels are crucial in day trading as they indicate price points where stock movements tend to pause or reverse. Support is where a downtrend may stop due to buying interest, while resistance is where an uptrend may stall due to selling pressure. New traders can use these levels to identify entry and exit points, set stop-loss orders, and make informed trading decisions. Recognizing these patterns helps traders anticipate potential price movements and manage risk effectively.
How Do I Use Moving Averages with Day Trading Patterns?
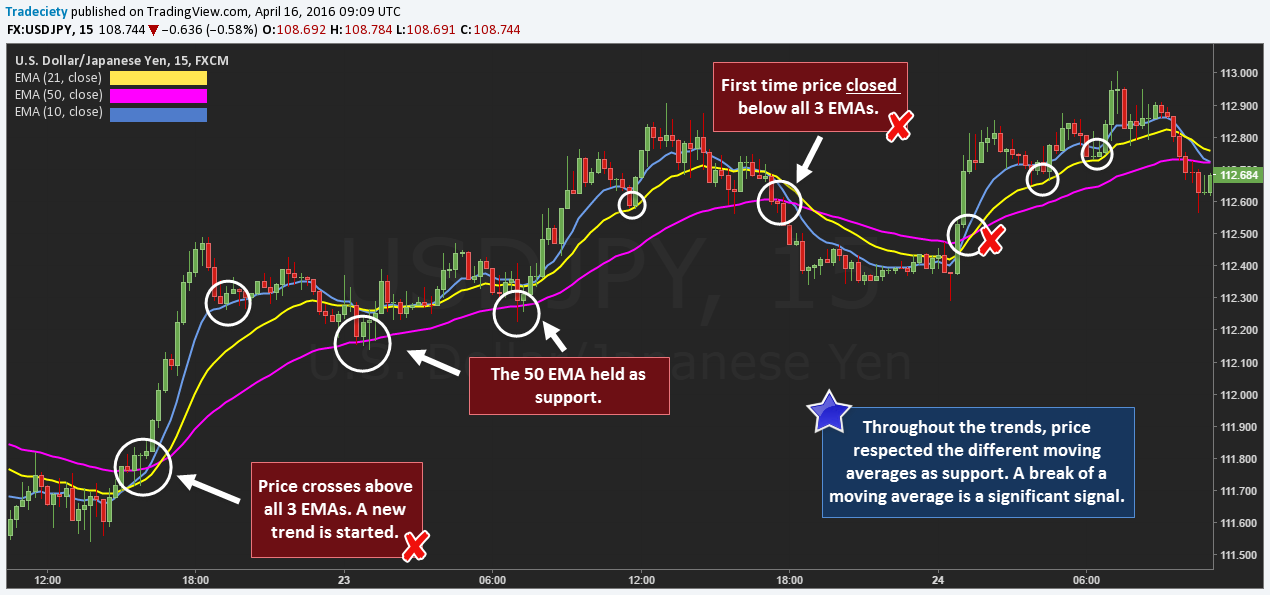
Use moving averages to identify trends and entry/exit points in day trading patterns. First, choose a short-term moving average (like the 9 or 20-period) and a longer-term one (like the 50-period).
When the short-term moving average crosses above the longer-term one, it signals a potential buy opportunity. Conversely, a cross below suggests a sell signal.
Combine moving averages with other patterns, such as flags or double tops, to confirm your trades. Always set stop-loss orders to manage risk effectively.
Learn about How to Use Moving Averages in Day Trading Charts
What Are the Risks Associated with Day Trading Patterns?
Day trading patterns come with several risks. First, market volatility can lead to rapid losses. Second, leverage amplifies both gains and losses, increasing the potential for significant financial setbacks. Third, emotional decision-making can result in impulsive trades, often leading to poor outcomes. Additionally, not understanding patterns can lead to misinterpretation, causing traders to enter or exit positions incorrectly. Finally, high transaction costs from frequent trading can erode profits. New traders should be aware of these risks before engaging in day trading.
Learn about What are the biggest risks associated with day trading mistakes?
How Can I Spot Fakeouts in Day Trading Patterns?
To spot fakeouts in day trading patterns, look for these signs:
1. Volume Analysis: Fakeouts often occur with low volume. If a breakout happens with weak volume, be cautious.
2. Quick Reversal: Watch for rapid price reversals immediately after a breakout. This can indicate a false move.
3. Candlestick Patterns: Look for rejection candles, like pin bars or engulfing patterns, that suggest a reversal after a breakout.
4. Key Support/Resistance Levels: Fakeouts frequently happen near established support or resistance. If price approaches these levels with little follow-through, it may be a fakeout.
5. Market Sentiment: Be aware of broader market sentiment. If news or events contradict the breakout, it’s likely a fakeout.
6. Confirmation Indicators: Use indicators like RSI or MACD for confirmation. If they show divergence during a breakout, it might be a false signal.
By combining these techniques, you can better identify potential fakeouts in day trading patterns.
Learn about How to Spot Reversal Signals on Day Trading Charts
What Technical Indicators Complement Day Trading Patterns?
Technical indicators that complement day trading patterns include Moving Averages (MA), Relative Strength Index (RSI), Bollinger Bands, and MACD (Moving Average Convergence Divergence). Moving Averages help identify trends, RSI shows overbought or oversold conditions, Bollinger Bands indicate volatility, and MACD signals potential reversals. Using these indicators alongside patterns like flags, triangles, and head and shoulders can enhance decision-making in day trading.
Learn about Integrating Technical Indicators into Your Day Trading Charts
How Do News Events Impact Day Trading Patterns?
News events significantly impact day trading patterns by creating volatility and influencing price movements. Traders often react to economic reports, earnings releases, or geopolitical developments, leading to rapid buying or selling. For example, a positive earnings report can cause a stock to spike, prompting day traders to enter positions quickly. Conversely, negative news can trigger sell-offs, causing traders to exit positions or short-sell. Understanding how to interpret news and its potential effects on stock prices is crucial for day traders to capitalize on these patterns effectively.
Learn about How News Events Impact Day Trading Decisions
What Tools Can Help Me Analyze Day Trading Patterns?
To analyze day trading patterns, use tools like TradingView for charting and technical analysis, Thinkorswim for customizable analysis, and MetaTrader for automated trading strategies. Consider using StockCharts for pattern recognition and Trade Ideas for AI-driven insights. Additionally, a reliable brokerage platform with built-in analytical tools can enhance your pattern analysis.
How Do I Develop a Trading Plan Using Patterns?
To develop a trading plan using patterns, start by identifying key patterns like flags, triangles, or head and shoulders. Set clear entry and exit points based on these patterns. Define your risk management strategy, including stop-loss orders to protect your capital. Use historical data to backtest your plan and ensure it’s effective. Keep a trading journal to track your trades, analyze results, and refine your strategy over time. Stay disciplined and adjust your plan as you gain experience.
Learn about How to Develop a Risk Management Plan for Day Trading
Conclusion about Day Trading Patterns: What New Traders Need to Know
Understanding day trading patterns is crucial for success in the fast-paced trading environment. By focusing on key patterns, recognizing candlestick formations, and analyzing volume, traders can make informed decisions. Identifying bullish and bearish patterns, along with reversal and continuation signals, enhances strategy development. Additionally, leveraging support and resistance levels, moving averages, and technical indicators can refine your approach. While risks exist, proper analysis and tools can mitigate them. For comprehensive insights and guidance, consider exploring resources from DayTradingBusiness to further elevate your trading skills.
Learn about What Should Day Traders Know About Regulatory Changes?